ChartWatchers March 17, 2013 at 04:48 AM
Hello Fellow ChartWatchers! We're starting to get "Spring Cleaning Fever" here at StockCharts... Read More
ChartWatchers March 16, 2013 at 05:10 PM
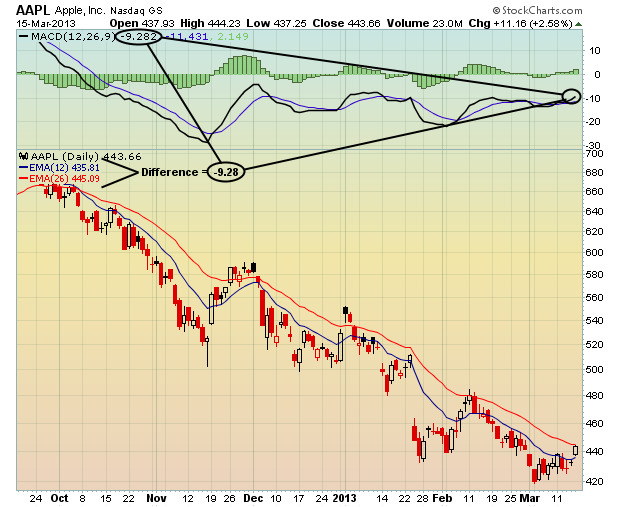
Personally, I love the MACD. It's one of my favorite technical tools when trading. It's not perfect - nothing is - but it does provide us a snapshot of momentum of a stock or index... Read More
ChartWatchers March 16, 2013 at 04:17 PM
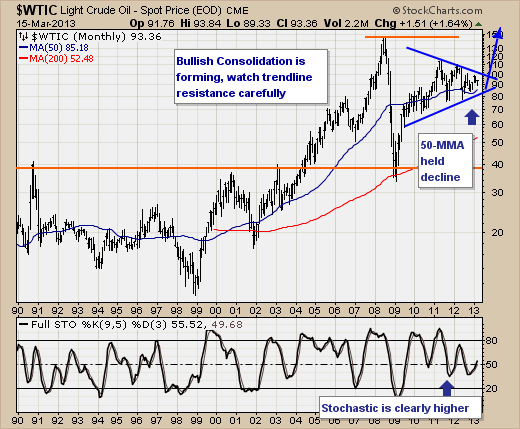
The stock market's uninterrupted gains in recent months is giving rise to talk of a bubble, and perhaps this is the case within the scope of time... Read More
ChartWatchers March 16, 2013 at 03:40 PM
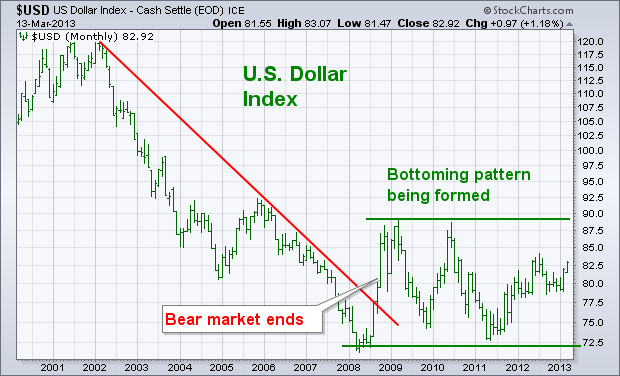
The monthly bars in Chart 1 plot the U.S. Dollar Index since 2001. Two major trends are seen on the chart. The first is the major downtrend in the dollar between 2002 and 2008. During 2008, the USD broke its six-year down trendline which ended its bear market... Read More
ChartWatchers March 16, 2013 at 03:36 PM
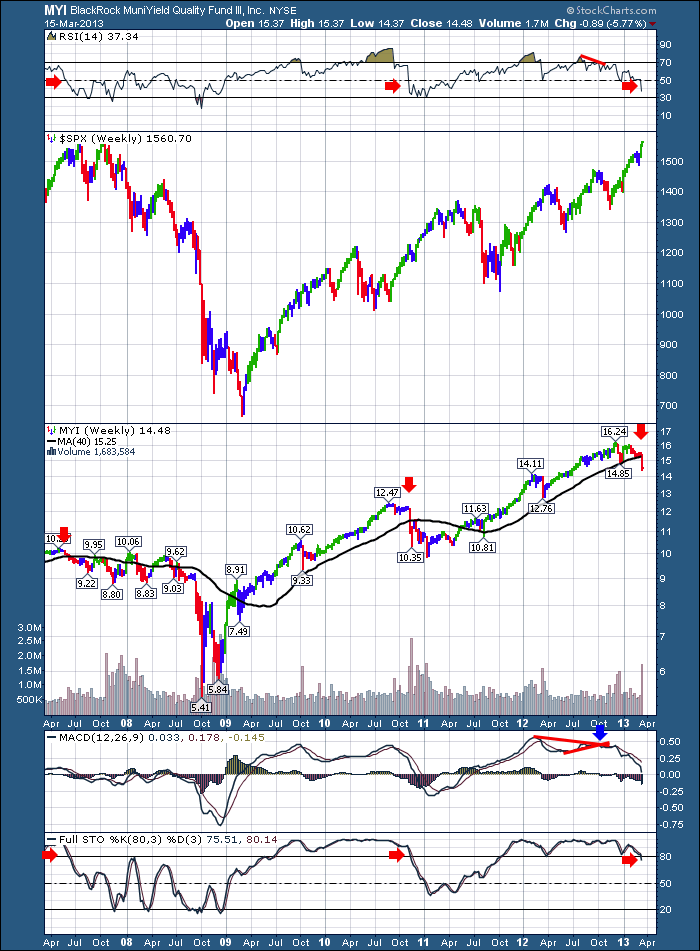
Strolling through the the mid month charts, I came across this ETF. This ETF represents Municipal Bonds. MYI It has only moved below its 40 WMA twice in the last 5 years. Till this week. It marks the third time... Read More
ChartWatchers March 16, 2013 at 10:58 AM
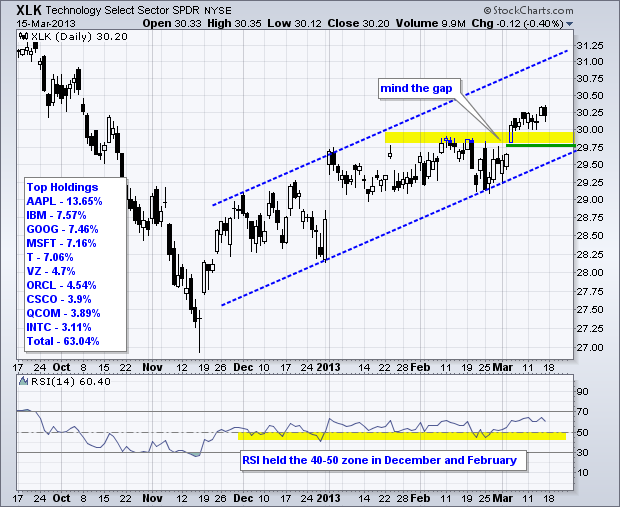
The Nasdaq 100 ETF (QQQ) and the Technology SPDR (XLK) have been underperforming the broader market, but both remain in uptrends since mid November and are holding their March gaps. Relative weakness stems from Apple, which is the biggest component for both ETFs... Read More
ChartWatchers March 15, 2013 at 06:32 PM
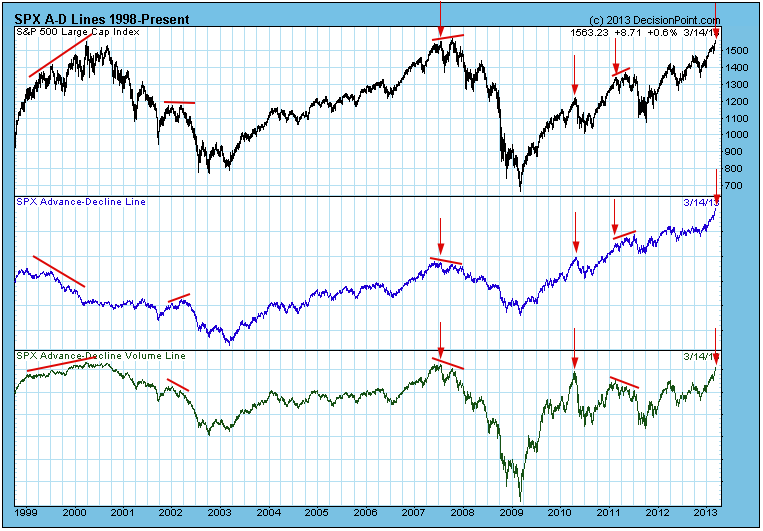
There are negative divergences on a lot of indicators we track (price makes a new high, but the indicators makes a lower high), but the advance-decline lines for breadth and volume are actually confirming the recent new price highs... Read More
ChartWatchers March 03, 2013 at 04:30 PM
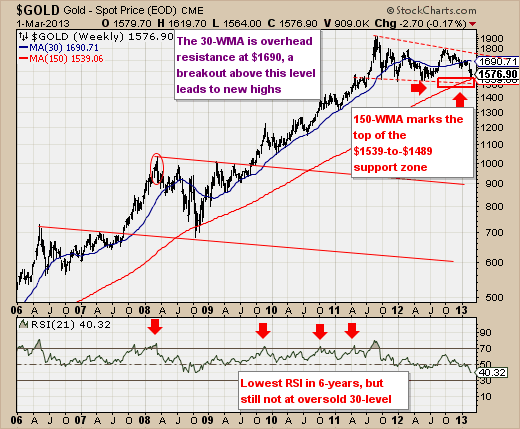
The past two trading weeks in the gold market has been rather dramatic: a sharp decline followed by a sharp rally and then a recent test of the lows. The end result - quite a bit of wailing and gnashing of teeth... Read More
ChartWatchers March 03, 2013 at 04:24 PM
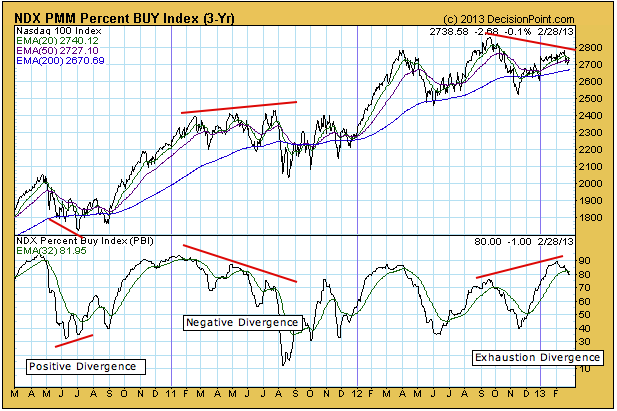
Textbook dIvergences occur when an indicator fails to keep up with price. For example, a positive divergence is when price makes a lower bottom, but the indicator makes a higher bottom. A negative divergence is when price makes a higher top, but the indicator makes a lower top... Read More
ChartWatchers March 03, 2013 at 04:07 PM
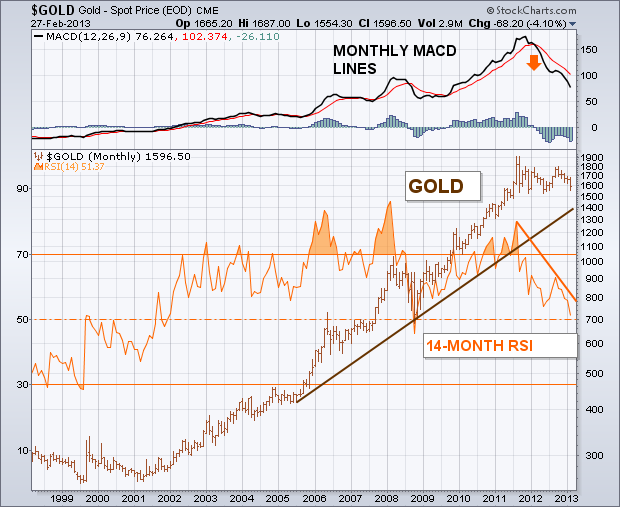
A lot of traders and investors are waiting for the bull market in gold to resume. They may have a very long wait. That's because a lot of traditional chart, technical, and intermarket signs are now working against gold. Let's start with a long-term look... Read More
ChartWatchers March 03, 2013 at 03:22 PM
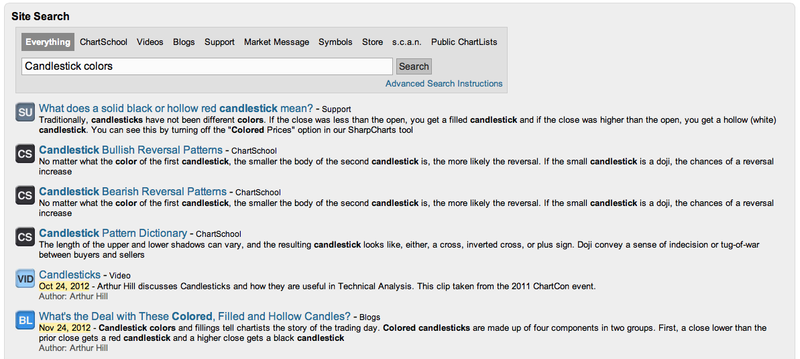
Hello Fellow ChartWatchers! Last weekend I had a great time giving our SCU 101 seminar to a room full of people at the Dolphin Hotel in Orlando... Read More
ChartWatchers March 03, 2013 at 03:08 PM

In my last article, I laid out several arguments why it would make sense to be more cautious as you approach the stock market. I'm bullish for the balance of 2013 - at least as of now - but the short-term has definitely turned more dicey... Read More
ChartWatchers March 02, 2013 at 01:49 PM
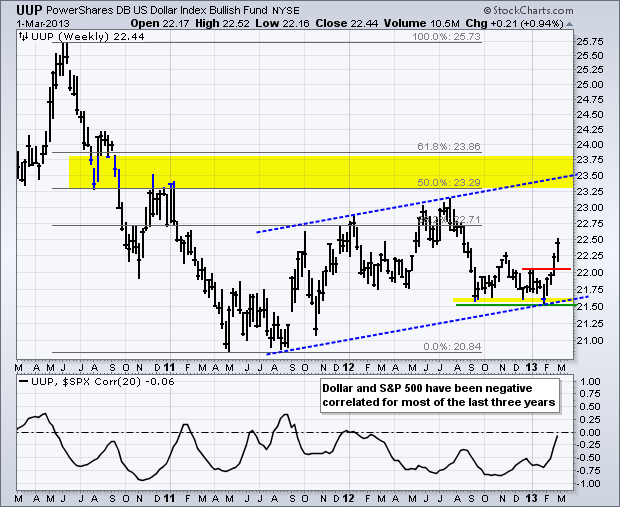
The Dollar Bullish ETF (UUP) extended its advance with a break above the mid November high this week and a fresh six month high... Read More