Strolling through the the mid month charts, I came across this ETF.
This ETF represents Municipal Bonds. MYI
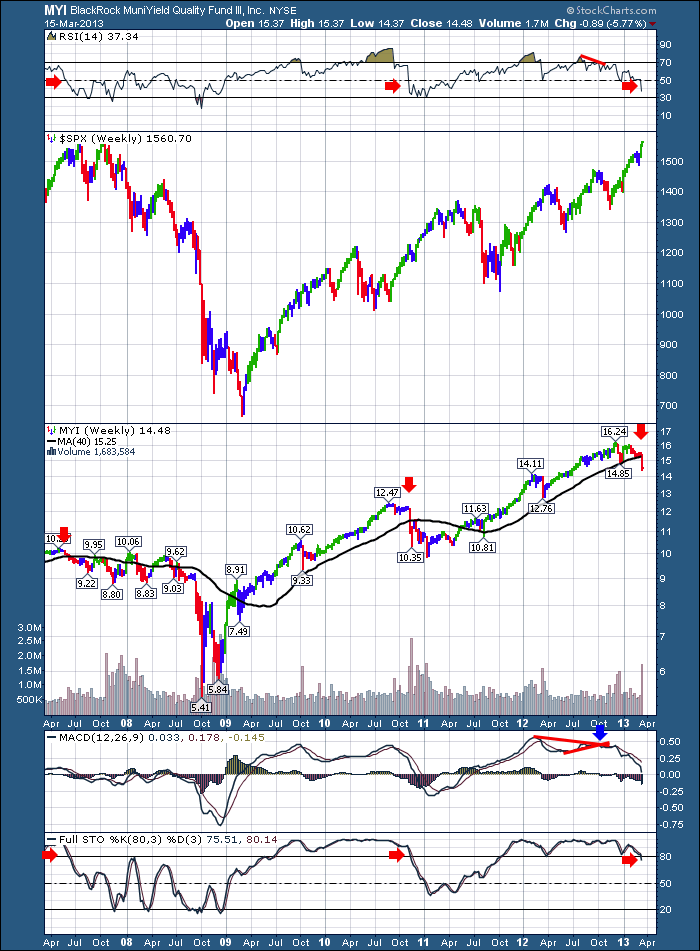
It has only moved below its 40 WMA twice in the last 5 years. Till this week. It marks the third time.
In 2007 it marked a drop early in the year and could not stay above the black line.
It tried twice in 2008 to get back above but failed in June and July. It was important.
In late 2010, it plummeted below the line, while the stock market went on a final run into April before correcting 20% in 2011.
This fund has shown more red in the last 3 months than at any time in the last 2 years.
At this point, its a heads up that something is going on in the Municipal Bond Market. We'll stay tuned to see if it has broader implications.
Good Trading,
Greg Schnell, CMT

