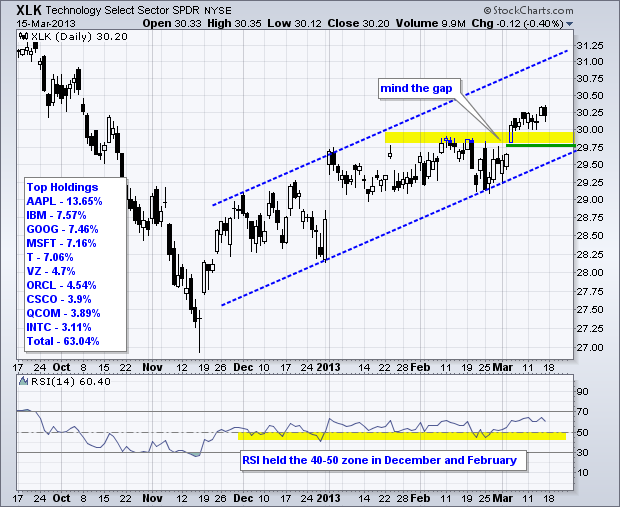
The Nasdaq 100 ETF (QQQ) and the Technology SPDR (XLK) have been underperforming the broader market, but both remain in uptrends since mid November and are holding their March gaps. Relative weakness stems from Apple, which is the biggest component for both ETFs. Microsoft, which accounts for over 7% of each ETF, has also been underperforming the broader market for several months. The first chart shows XLK breaking above resistance at 30 with a gap-surge in early March. This breakout is holding with broken resistance and the gap marking a support zone. A move below 29.75 would fill the gap and negate the breakout. RSI confirms that the cup is half full. Notice that this momentum oscillator held the 40-50 zone in December and again in February. Momentum favors the bulls as long as RSI holds above 40. I suspect that RSI would break 40 if/when XLK breaks the December trend line.


The second chart shows QQQ with similar characteristics. A small flat consolidation formed after the surge. This looks like a flag, which could be flying at half-mast. A breakout would signal a continuation higher and target a move to around 70. The flagpole extends 3 points (±66 to ±69) and this amount is added to the flag low (±68 + 3 = 71).
Happy St Paddy's Day!
Arthur O'Hill CMT
