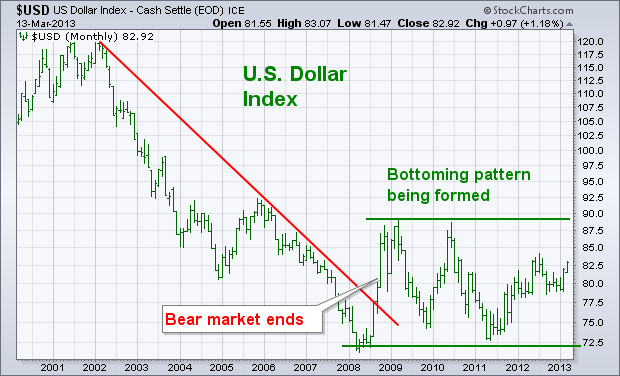
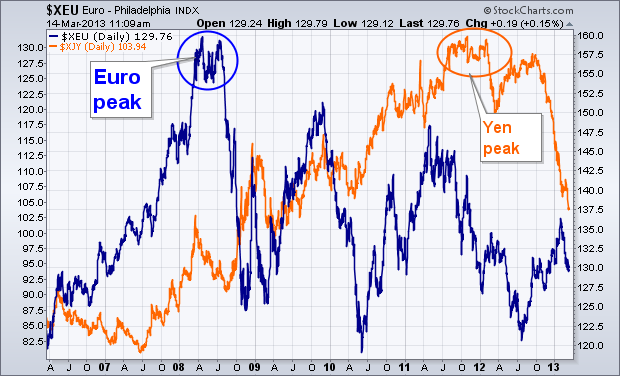
The monthly bars in Chart 1 plot the U.S. Dollar Index since 2001. Two major trends are seen on the chart. The first is the major downtrend in the dollar between 2002 and 2008. During 2008, the USD broke its six-year down trendline which ended its bear market. Since then, the USD has trended sideways in what appears to be a major bottoming pattern (see parallel lines). To complete that bullish pattern, the USD would have to clear its 2009-2010 highs. Although that hasn't happened yet, it isn't too soon to consider the possible implications of the dollar becoming the world's strongest currency for the first time in more than a decade. The most obvious implication is that the dollar will do better than most foreign currencies. That makes the dollar a much better bet. Chart 2 shows what has happened to the world's two biggest foreign currencies since the dollar bottom during 2008. The Euro peaked that year and has fallen since then. [The Euro has the biggest weight in the USD]. The orange line shows the Japanese Yen peaking during the fourth quarter and tumbling during this quarter. Forex traders have been buying the dollar and selling the Euro and yen (as well as most other foreign currencies). Currency trends reflect how the world views economic prospects for the various economies. Dollar strength suggests that the U.S. economy is in better shape than most foreign markets. There are other intermarket implications of a stronger dollar. One of the most obvious is its impact on commodity markets.


