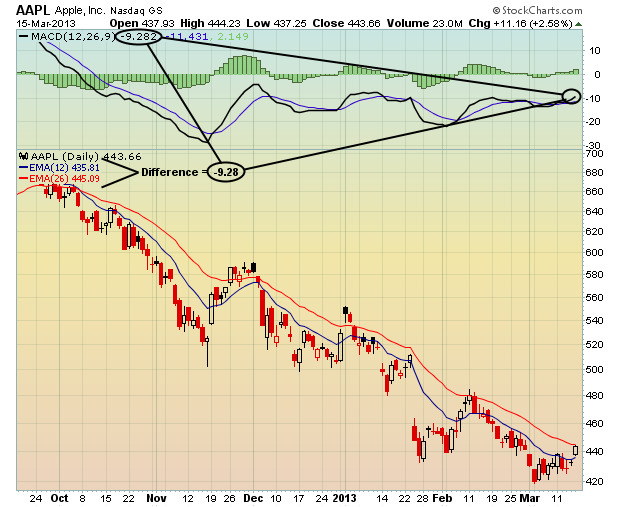
Personally, I love the MACD. It's one of my favorite technical tools when trading. It's not perfect - nothing is - but it does provide us a snapshot of momentum of a stock or index. The MACD is nothing more than the difference between two exponential moving averages, with the standard being the 12 period and 26 period EMAs. I follow this standard MACD.
As a refresher, here's a daily 6 month chart of Apple (AAPL) with the standard 12 day and 26 day EMAs reflected on the chart:

That is a static look at AAPL's MACD as of Friday's close. By changing the settings on the moving averages to the 12 day EMA and 26 day EMA, you can see clearly how all of the MACD-related numbers tie together. But it's the ebbs and flows of the MACD (momentum) that really grab my attention in order to assess risk.
Any time the price of a stock moves up, you should expect the short-term moving average to rise quicker than the long-term moving average. To the contrary, a declining stock price should see its short-term moving average falling faster than its long-term moving average. Once that relationship changes and divergence turns to convergence, it's a warning that the momentum could be waning and the RISK of a quick shift in trend direction should be considered. That's the real beauty of the MACD. It's not just a lagging indicator. It also can become a very strong PREDICTIVE indicator.
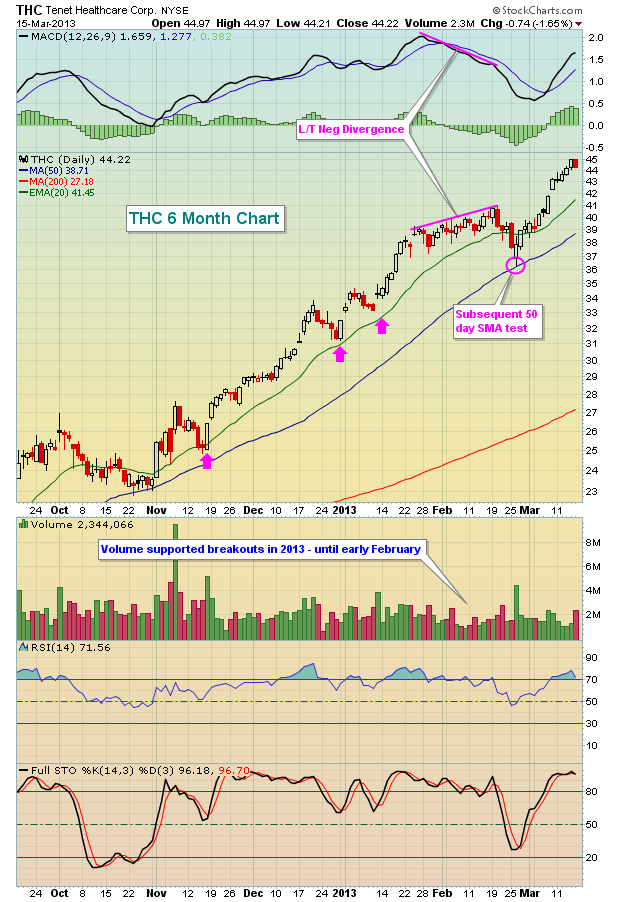
In my February 16th article, I discussed the potential risks of long-term negative divergences and how they might potentially influence the short-term direction of 5 S&P 500 stocks that were moving higher. The problem was they possessed the signs of slowing momentum - ie, long-term negative divergences. All 5 of these stocks suffered temporarily as their price fell and their MACD began moving back towards centerline support. In my view, that's all I'm looking for to the down side - a 50 day SMA test and/or a MACD centerline "reset". Below is the chart of one of these 5 stocks, Tenet Healthcare (THC), which also happens to be one of the strongest stocks in the market of late. Its SCTR rank is among the highest in the market. But check out its chart:

This is a perfect example that shows a long-term negative divergence offering us a warning of potential weakness ahead. In addition to the weak momentum in price action, look at the lack of volume that accompanied the breakout of THC in the first couple weeks of February. Light volume breakouts are another sign of slowing momentum and further corroborates the negative divergence on the MACD. Taking a more cautious approach to THC in mid-February - either by selling shares and moving to cash or possibly selling a covered call - would have reduced the risk of holding and enabled a long trader to hold onto profits generated through mid-February. Re-entry on the subsequent 50 day SMA test would have saved perhaps 8-10%.
Remember, long-term negative divergences are not necessarily a bearish development, especially in an otherwise bullish market environment. But they do signal that short-term risks are elevated and that it's time for the short-term trader to alter his or her trading strategy accordingly. And for those looking to take an initial long position in such a stock, it would probably behoove them to wait until a 50 day SMA test and/or a MACD centerline approaches before committing capital.
Happy trading!
Tom Bowley
Chief Market Strategist
Invested Central
