ChartWatchers July 31, 2009 at 04:29 PM
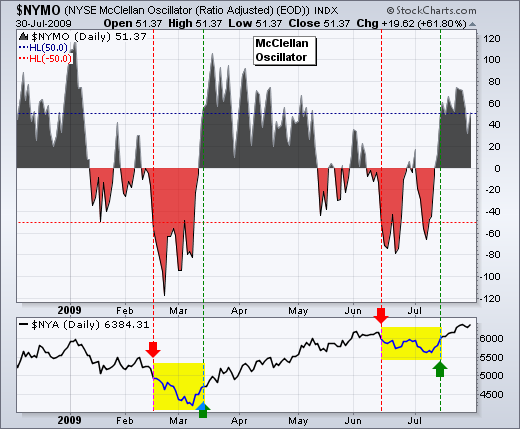
The McClellan Oscillators moved from bearish to bullish with the July surge in stocks. Basically, the McClellan Oscillator is the 19-day EMA of Net Advances less the 39-day EMA of Net Advances (advances less declines)... Read More
ChartWatchers July 19, 2009 at 06:37 PM
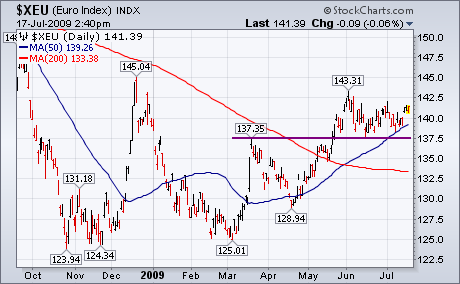
It looks like you can throw out most of what I wrote last Friday. I was expecting a deeper market correction after most market indexes broke short-term head and shoulder "necklines" (and daily EMA lines turned negative)... Read More
ChartWatchers July 18, 2009 at 10:49 PM
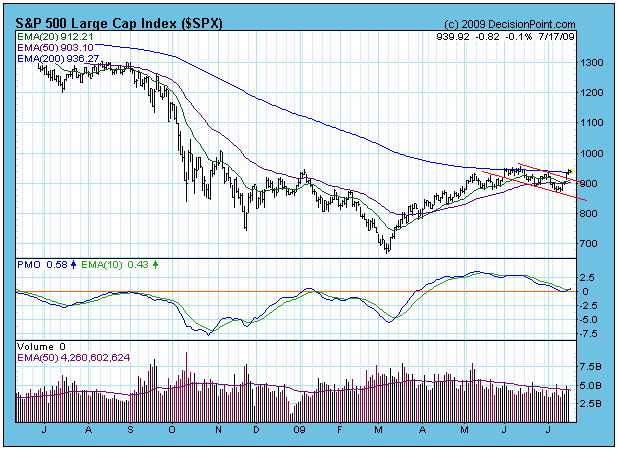
Last week I presented an alternate scenario to the head and shoulders breakdown and projected decline: "While the bearish case seems strongest at this point, a bullish outcome is not impossible... Read More
ChartWatchers July 18, 2009 at 10:43 PM
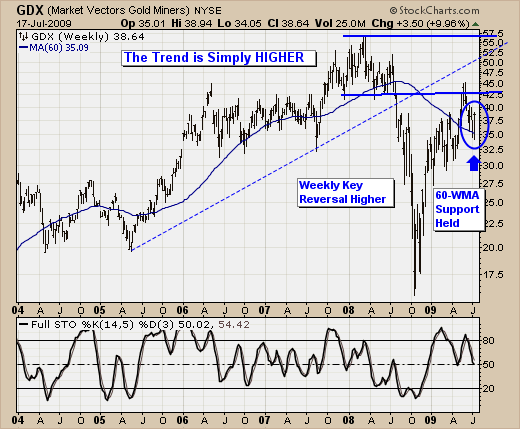
As the summer doldrums set in, we've seen quite a bit of back and forth in the various capital markets, with prices not moving far from where they were just 2-months prior... Read More
ChartWatchers July 18, 2009 at 10:24 PM
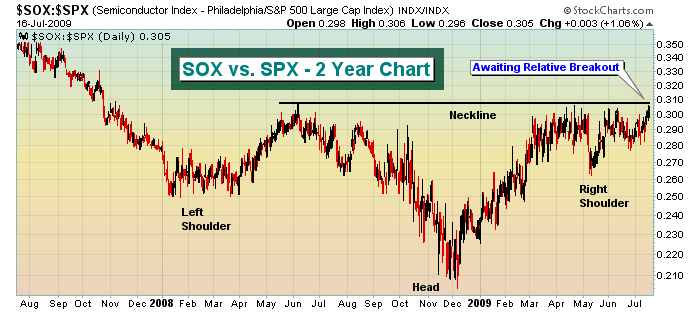
This first chart really says it all: Semiconductors are trying to break out on a relative basis. They're trying to do it at a time when the major indices are attempting breakouts of their own... Read More
ChartWatchers July 17, 2009 at 03:19 PM
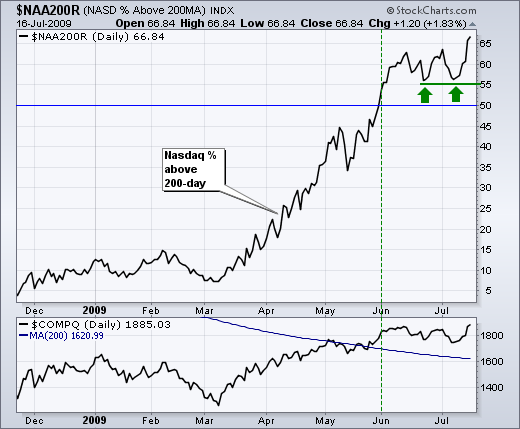
It is hard to argue with the bulls when the vast majority of Nasdaq and NYSE stocks are trading above their 200-day SMAs. Over 66% of Nasdaq stocks are trading above their 200-day moving averages, while over 77% of NYSE stocks are trading above their 200-day moving averages... Read More
ChartWatchers July 05, 2009 at 03:03 PM
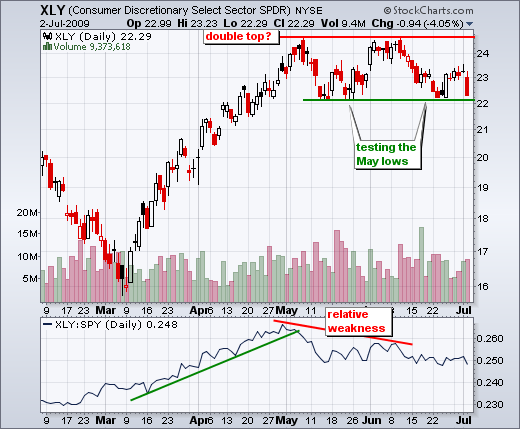
Non-farm payrolls declined 467,000 for June, which was worse than expected. Stocks took the news hard with a broad based decline on Thursday... Read More
ChartWatchers July 04, 2009 at 03:38 PM
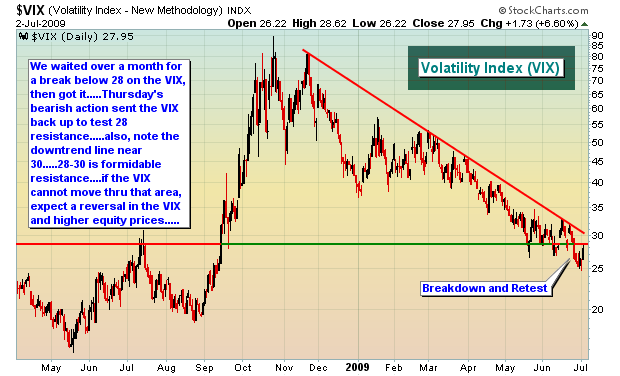
I believe it's the former. Thursday's selloff after the June Employment report was a bit scary, particularly if you're only looking at the magnitude of the point losses. But, in my opinion, no key support levels have been violated... Read More
ChartWatchers July 03, 2009 at 07:51 PM
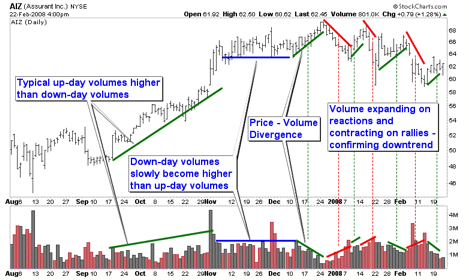
This is the tenth part of a series of articles about Technical Analysis from a new course we're developing. If you are new to charting, these articles will give you the "big picture" behind the charts on our site... Read More
ChartWatchers July 03, 2009 at 05:17 PM
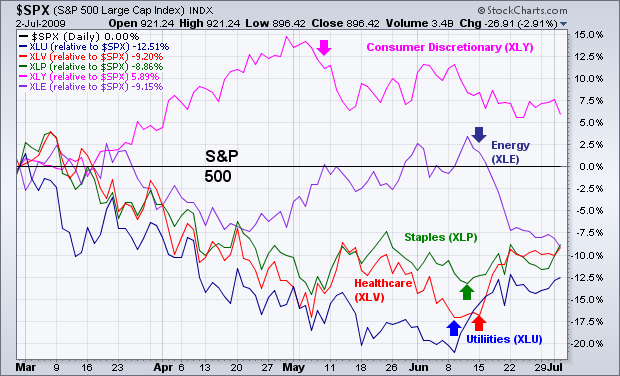
A sign that investors have turned more negative over the last month is the rotation out of economically-sensitive groups (like consumer discretionary and energy stocks) and into defensive groups (like utilities, consumer staples, and healthcare)... Read More
ChartWatchers July 03, 2009 at 05:09 PM
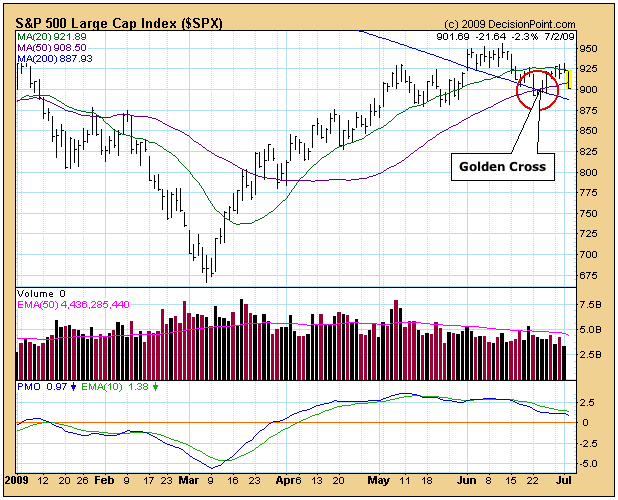
About a week ago the S&P 500 50-SMA (simple moving average) crossed up through the 200-SMA. (See chart below.) This is known as a "Golden Cross" because it is interpreted by many as a sign that the market is turning long-term bullish... Read More