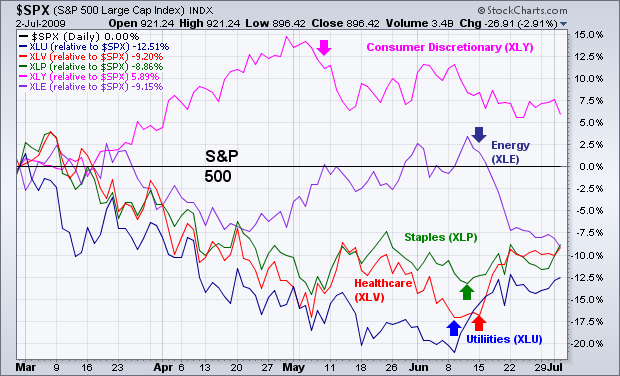
A sign that investors have turned more negative over the last month is the rotation out of economically-sensitive groups (like consumer discretionary and energy stocks) and into defensive groups (like utilities, consumer staples, and healthcare). Chart 3 shows relative strength lines for those five groups (versus a flat S&P 500) since the start of June. The downturn in the Discretionary SPDR (XLY) performance in early June is consistent with views that retail spending is being held hostage by rising unemployment numbers (which were borne out yesterday). The downturn in energy (XLE) is consistent with weaker commodity prices owing to a strong U.S. Dollar. Three of June's best performers are defensive staples (XLP), healthcare (XLV), and utilities (XLU). All of those rotation shifts are consistent with a much-needed correction in a market that's risen too far too fast. While stocks and commodities fell together during June, money has moved back into Treasury bonds and the U.S. Dollar.

