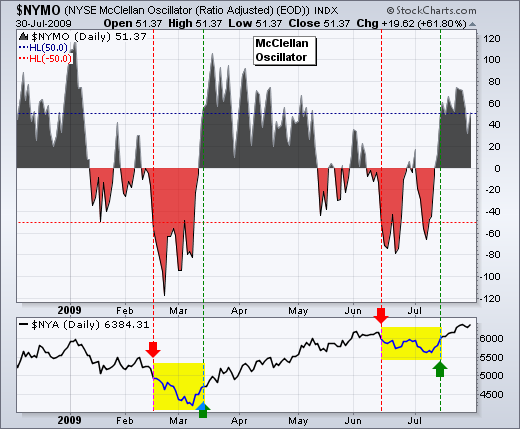
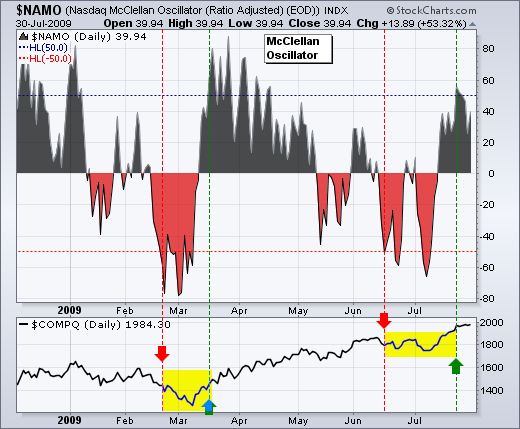
The McClellan Oscillators moved from bearish to bullish with the July surge in stocks. Basically, the McClellan Oscillator is the 19-day EMA of Net Advances less the 39-day EMA of Net Advances (advances less declines). As the difference of two moving averages, this indicator oscillates above/below the zero line like MACD. Based on recent observations, a thrust above 50 is viewed as bullish for the stock market, while a thrust below -50 is viewed as bearish. Even though this breadth indicator is not perfect, it's level can help determine overall market direction and underlying strength.

Click this chart to see more details.

Click this chart to see more details.
The Nasdaq and NYSE McClellan Oscillators both turned bearish in mid June with thrusts below -50. Both stayed in bear mode until mid July. The NYSE McClellan Oscillator was the first to turn bullish with a thrust above 50 on 15-July. Also notice that the NY Composite broke above 6000 on 15-July. The Nasdaq followed suit a week later with a move above 50 on 23-July. Even though both oscillators slipped back this week, they remain comfortably in positive territory and bullish overall. Click here to read more on the McClellan Oscillator and Summation Index.
