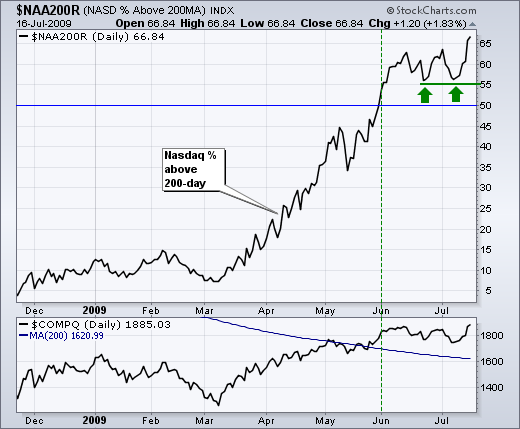
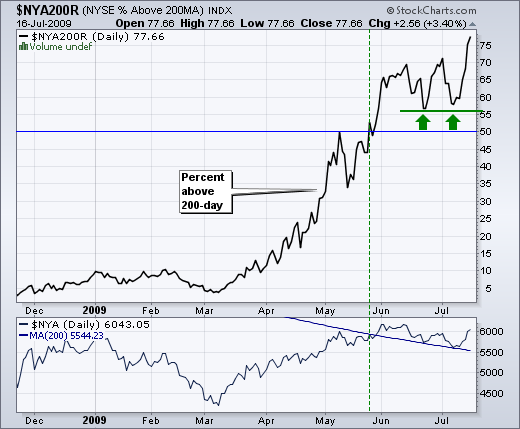
It is hard to argue with the bulls when the vast majority of Nasdaq and NYSE stocks are trading above their 200-day SMAs. Over 66% of Nasdaq stocks are trading above their 200-day moving averages, while over 77% of NYSE stocks are trading above their 200-day moving averages. There are two important parts to this indicator: absolute level and direction. Despite some stalling over the last 6 weeks, the overall direction is up for both breadth indicators. There have been pullbacks along the way, but the overall trend since late March is up. The bulls are in control as long as this uptrend holds.
Both indicators moved above the critical 50% threshold at the end of May. There was some market weakness in late June and early July, but the moving average percents held above 55%. In fact, both established support at 55% with bounces in late June and early July (green arrows). This looks like an important support level for the indicator. The bulls are in good shape as long as both hold above 55%. A move below this support would argue for a correction or consolidation period in the market.


