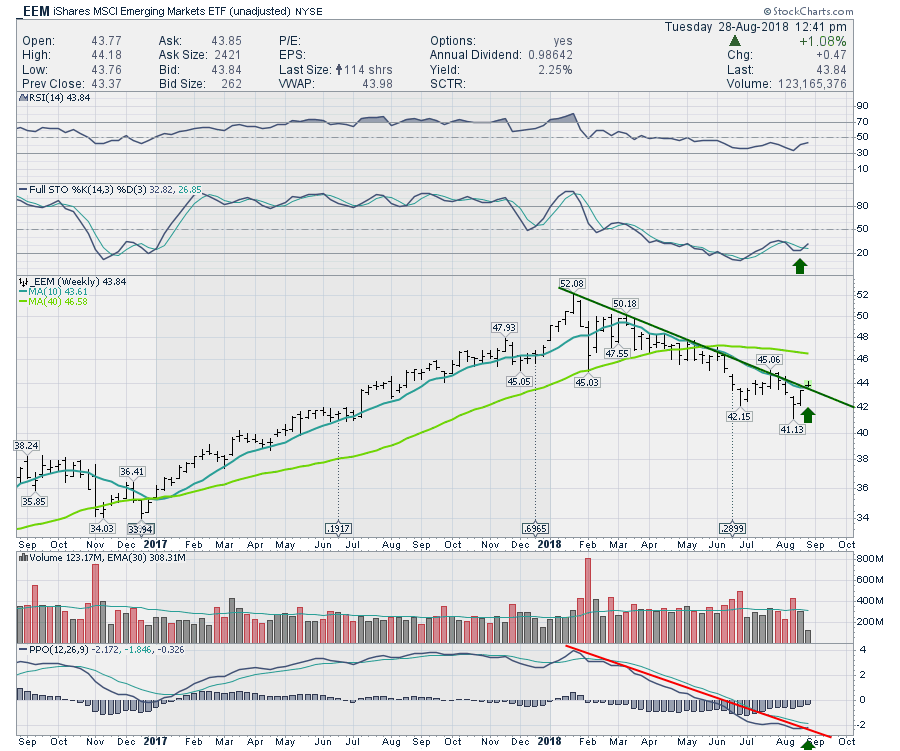
The emerging markets have been falling as the US Dollar was rising. With the sudden reversal on the $USD there are some charts shaping up nicely. The EEM chart has nice positive divergence on the Full Stochastic.
If the $USD continues to weaken, this trade should continue to improve. For now, its a nice breakout with a signal. A stop that gets hit below last weeks low of $42 would suggest the trade is not going to work.
There have been a wide variety of new videos over the last week. Here are links to them.
The Canadian Technician.
The Commodities Countdown video covers off the setups in the precious metals charts this week.
The Final Bar.
I appeared on MarketWatchers Live August 24th, 2018 hosting a segment called Everything StockCharts. You can see the entire show here.
You can also click here to see Market Watchers Live Monday August 20, 2018.
I also updated my Commodities Countdown Chartlist. 30 Charts with a high level view of whats going on.
If you are missing intermarket signals in the market, follow me on Twitter and check out my Vimeo Channel often. Bookmark it for easy access!
Good trading,
Greg Schnell, CMT, MFTA
Senior Technical Analyst, StockCharts.com
Author, Stock Charts for Dummies
Want to read more from Greg? Be sure to follow his two StockCharts blogs:
Commodities Countdown and The Canadian Technician

