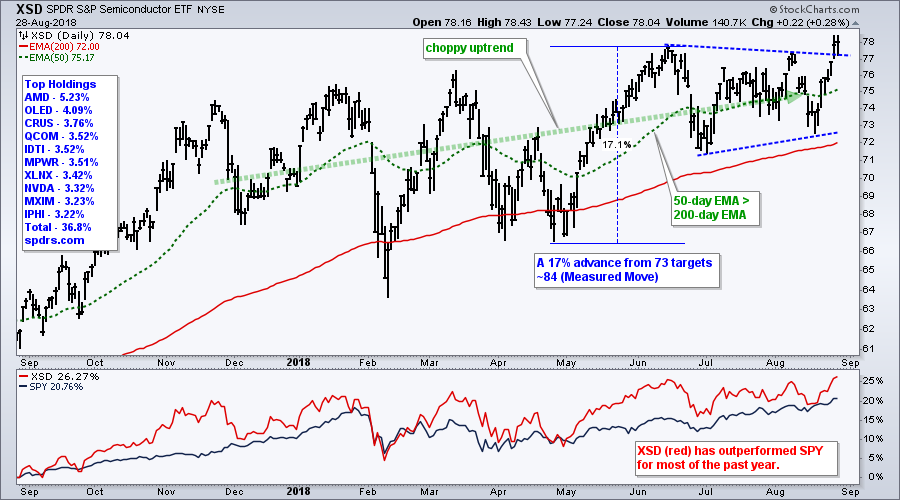
 Chips are leading the market again as the broad-based Semiconductor SPDR (XSD) broke out of a triangle consolidation and hit a new high. A new high in this cyclical group is positive for the technology sector, the Nasdaq and the broader market.
First note that XSD has 34 components and they are relatively equally weighted. AMD, which as a market cap of $24 billion, is the largest holding (5.23%) and Intel (2.77%), market cap $224 billion, is not even in the top ten. The Semiconductor iShares (SOXX), in contrast, is weighted towards large-caps with the top ten stocks accounting for 59% of the ETF. XSD reflects performance for the "average" chip stock.
On the price chart, XSD has been in a choppy uptrend since November with a series of higher highs throughout 2018. After a 17% surge in May-June, the ETF consolidated with a triangle and then broke out with a surge the last seven days.
Chartists can use the Measured Move technique to guesstimate an upside target by projecting another 17% move from the triangle low, which is around 84. A 17% advance from this low would target a move to the 84 area. Keep in mind that this is a loose price target and chartists should re-evaluation as new price bars materialize.
On Trend on Youtube
Available to everyone On Trend with Arthur Hill airs Tuesdays at 10:30AM ET on StockCharts TV and repeats throughout the week at the same time. Each show is then archived on our Youtube channel.
Topics for Tuesday, August 28th:
- Industrials Extend as Materials Surge (ITA, DWDP)
- Finance and Brokers Pop, but Regionals Flatline
- Focus on Finance (GS, JPM, MS, BAC, C, SCHW)
- Biotech ETFs Surge (XLV, IHI, IHF hit new highs)
- Ask Arthur: GoldenX, Market Timing, Bond/$ Correlation, Scan Code
- Stocks/ETFs to Watch: ITB, PX, TMUS, MRO, NOV, ICE
Plan Your Trade and Trade Your Plan.
- Arthur Hill, CMT
Senior Technical Analyst, StockCharts.com
Book: Define the Trend and Trade the Trend
Twitter: Follow @ArthurHill

