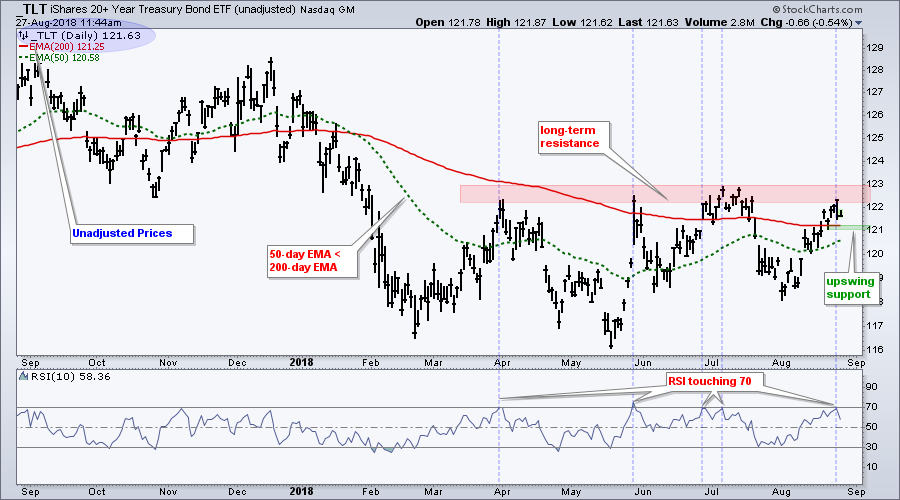
 The unadjusted 20+ YR T-Bond ETF (_TLT) surged to resistance on Friday and backed off on Monday. The long-term trend is down and this resistance level could mark a near term top.
First note that the chart shows unadjusted prices for TLT by preceding the symbol with an underscore (_TLT). This removes the monthly distributions from the price. Second, note that the long-term trend is down because the 50-day EMA is below the 200-day EMA and price hit a 52-week low in May.
On the price chart, TLT hit resistance in the 122-123 area in late March, late May and early July. Also notice that RSI reached the 70 area each time. TLT is once again challenging resistance in this area and RSI was near 70 on Friday. Thus, the ETF is short-term oversold and at resistance. Giving the long-term downtrend, this setup could foreshadow a near-term peak (reversal).
Overall, notice that TLT has been in a trading range since February. The ETF is at the top of this range and the current swing within the range is up. The August 24th low marks upswing support at 121 and this is the first level to watch for a short-term reversal.
On Trend on Youtube
Available to everyone On Trend with Arthur Hill airs Tuesdays at 10:30AM ET on StockCharts TV and repeats throughout the week at the same time. Each show is then archived on our Youtube channel.
Topics for Tuesday, August 27th:
- Bull Flags in XLK, HACK and SKYY
- XLI Breaks out as XLF Fills Gap
- XLE - Support Break vs. Oversold Setup (plus XES, USO)
- XRT Leads Consumer Discretionary SPDR (plus ITB)
- IAI Tests Support as KRE Turns Up (plus SCHW and ETFC)
- Stocks to Watch: ANSS, FFIV, JBHT, LMT, ULTA and more
- Click here to Watch
Plan Your Trade and Trade Your Plan.
- Arthur Hill, CMT
Senior Technical Analyst, StockCharts.com
Book: Define the Trend and Trade the Trend
Twitter: Follow @ArthurHill

