This week, the market moved down every day. Wednesday spent the entire day below Tuesday's close except for the last few minutes. That does make a short term trend, again a short term trend.
By closing Friday without rebounding, it would appear that investors didn't want to jump in and push the market higher on a Friday close.
I have three charts that tell me the market is setting up to be more defensive. Is it next week? We don't know, but we do know money is shifting in defensive areas.
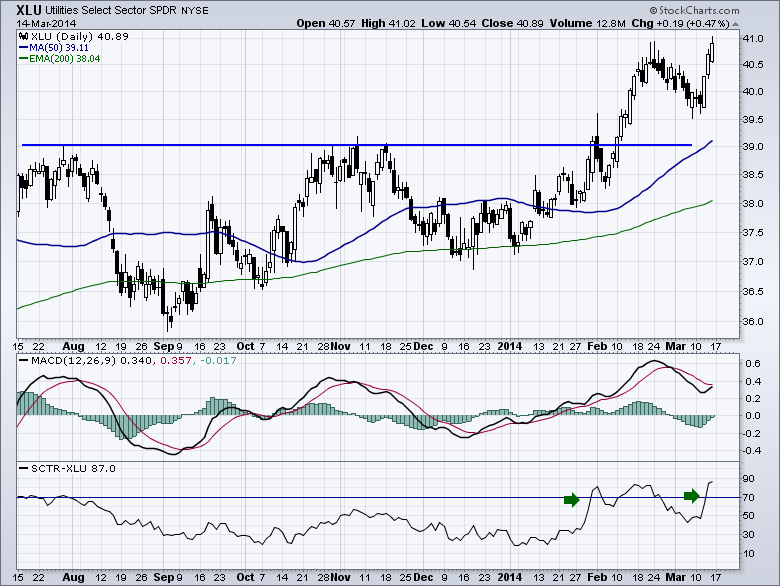
My first chart is the XLU. The SCTR has now pushed up above 70. It started back in January, pulled back and has now moved back above 70. This is an indication of moving out of growth and into safety.
It is this renewed commitment after pulling back that leads me to believe the market is more and more comfortable being defensive.
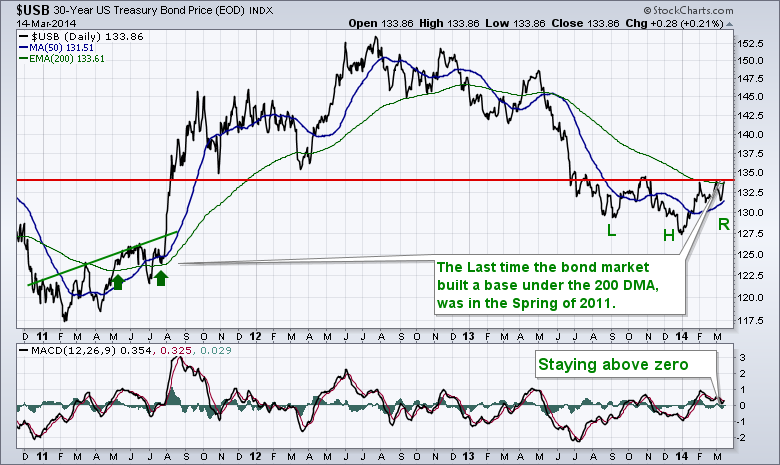
Below is the Bond market. The price is rising above the 200 DMA. This indicates buyers willing to pay up for bond yields.
When I look back over the last 30 years of this bond market trend, I have noticed that when the long bond runs above the 200 DMA it is usually a flag for a more defensive posture in portfolios. So we are at the decision point. If you look back to 2011, It was not immediate, but it was a very good time to add safety and wait for the equity market to decide the final direction.
For my third chart, I wanted to demonstrate a newer tool for indicating market direction.
The information contained in the SCTR indicator is still being developed. Here is an interesting trend I discovered, that should be monitored for further usage in our decision making process regarding market direction.
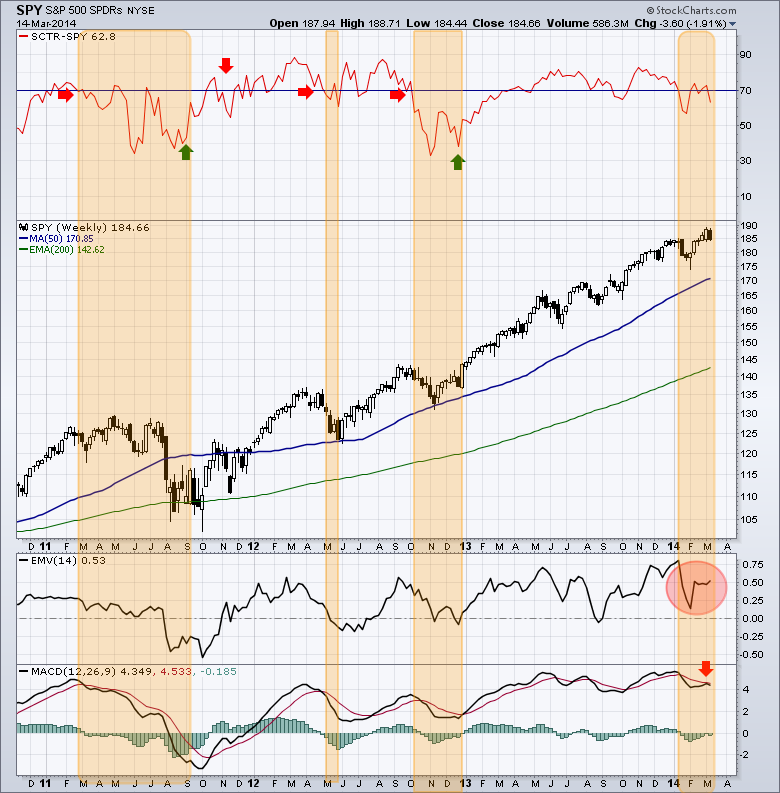
When the SPY ETF is plotted with an SCTR line, it reveals a very interesting trait.
When the SCTR goes below 70, it seems to reveal weakness. In reality, this would mean that other ETF's are outperforming the SPY. It could be bond ETF's or Money Market ETF's are starting to rise and the SPY is getting weaker within the grouping of ETF's. I have represented the areas in orange as the SCTR weakening below 70. It is also important to recognize whipsaw areas. Whipsaws are the biggest pain in analysis for technicians. I have represented one with a down arrow in red, but the SCTR bounced back up after showing weakness. You can find another in the September 2013 area.
It would also be important to recognize that you don't wait for the SCTR to get back above 70 before you want to invest. You want the SCTR line to start making higher highs. I think its worth monitoring as a good signal for broader equity weakness.
I have put the Richard Arms - EMV - 'ease of movement' indicator on this chart. Recently (December 2013) the ease of movement indicator hit some very high levels. While it has pulled back to lower levels, the ease of movement indicator is still quite high, unlike the other 3 shaded areas.
I think the decline in the EMV from the highs is worth noting and the indicator is based over 14 days. So this may suggest the market is still strong enough to go higher. I would watch to see if the market continues to pull back next week, will this indicator pullback to confirm the SCTR direction?
The MACD has also turned down. Many technicians regard the MACD's failure to cross back above the signal line as a confirmation of direction. Like a failed signal, it demonstrates a change in behaviour from bullish to weakness.
We are still only a week off the highs. Many of the primary charts are in a position to confirm or deny the weakness. The next few weeks should give us answers. Tops usually take a long time to build. The weakness should start to show up on indicators like the percentage of stocks above the 50 DMA and 200 DMA if that is what is happening. We'll look there as the month progresses. $SPXA50R and $SPXA200R are the names of those indicators.
Good trading,
Greg Schnell, CMT.


