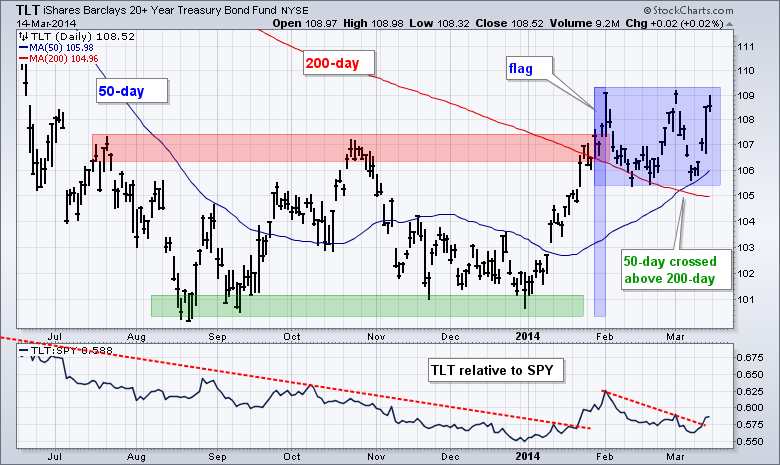
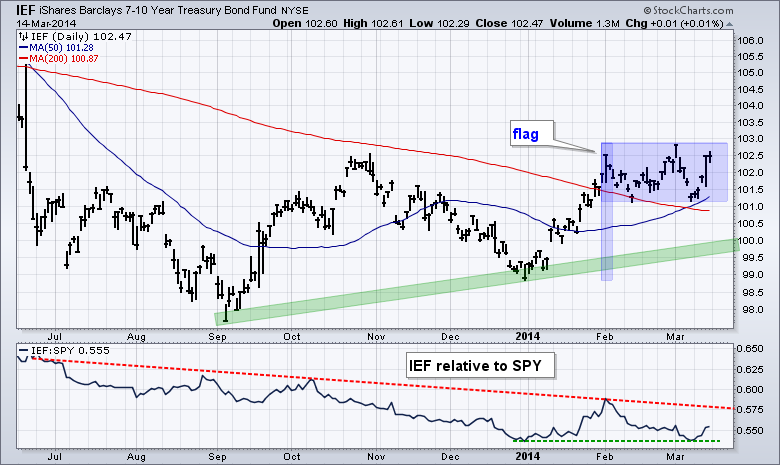
Stocks and bonds have been inversely correlated for most of the last four years, which means they tend to move in opposite directions. This inverse correlation showed up in January as stocks swooned and Treasuries surged. February was mixed because stocks surged and Treasuries traded flat. The inverse correlation reasserted itself this week as stocks dipped and Treasuries surged. I am particularly interested in this weeks surge because the 7-10 YR T-Bond ETF (IEF) and 20+ YR T-Bond ETF (TLT) held their golden crosses. A golden cross occurs when the 50-day moving average moves above the 200-day moving average.

The chart above shows TLT breaking out with the January surge and then moving into a flat consolidation that looks like a flag. Notice how the 50-day day moved above the 200-day in early March and TLT found support near this cross. The ability to hold these moving averages and the golden cross are long-term bullish for TLT. Medium-term, the flat flag is a bullish continuation pattern. A break above the flag highs would signal a continuation higher and target a move to the 114 area. A flag flies at half-mast and the flagpole extends around 8.5 points (100.7 to 109.2). An 8.5-point advance from the flag lows would project such a move. A upside breakout in Treasuries would be negative for stocks and could facility further selling pressure. The chart below shows IEF with similar characteristics.

