ChartWatchers May 21, 2011 at 07:03 PM

Hello Fellow ChartWatchers! This week's newsletter features some great Bullish vs. Bearish discussions including some Elliot wave analysis from John Murphy. I also wanted to take time to remind everyone that our Spring Special will end shortly... Read More
ChartWatchers May 21, 2011 at 04:28 PM
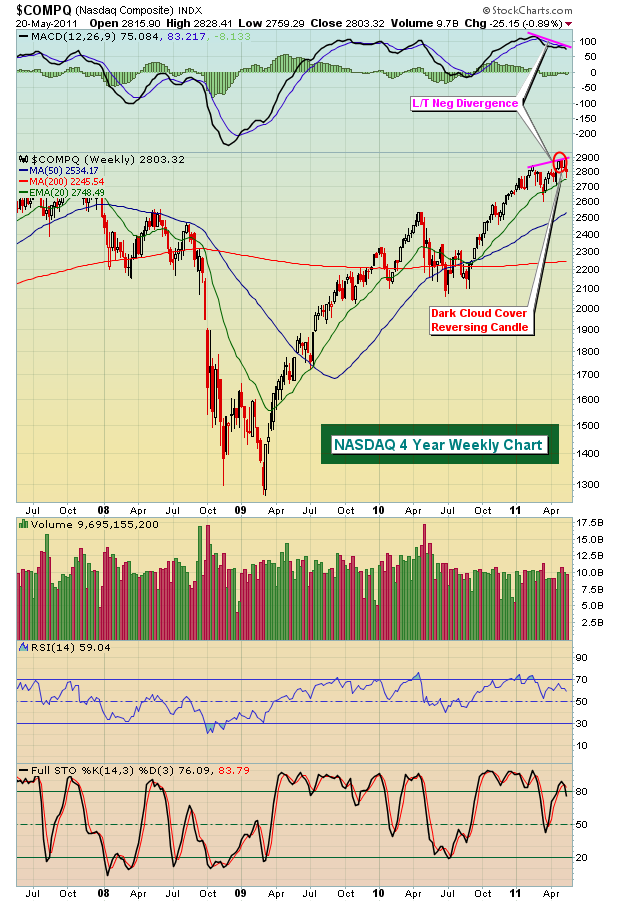
Issues are mounting and the pressure is definitely weighing on the bulls. While we haven't seen any major breakdowns to confirm several bearish signs, you should be approaching the market with caution in my opinion... Read More
ChartWatchers May 21, 2011 at 03:44 PM
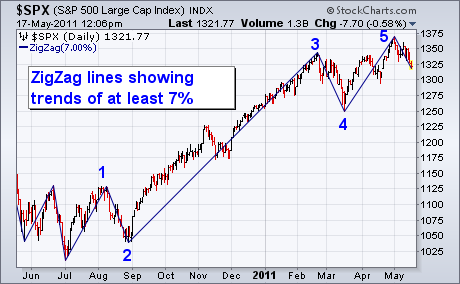
Determining Elliott Wave counts can be very subjective. One way to make it little easier is to employ a "ZigZag"overlay on the price chart. [The ZigZag is located in the same Overlays menu that includes moving averages]... Read More
ChartWatchers May 21, 2011 at 03:42 PM
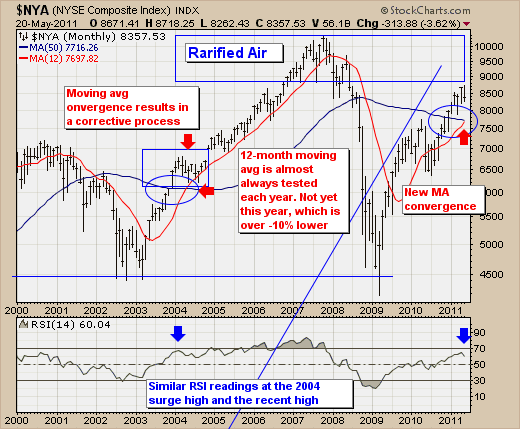
Since the end of April, the broader market as defined by the NYSE Composite Index has been in a corrective mode... Read More
ChartWatchers May 21, 2011 at 03:37 PM

A reader recently called me a perma-bull, which is amusing, since by nature I'm usually disposed toward bearishness. I will, however, remain bullish until our mechanical timing model switches from a buy... Read More
ChartWatchers May 21, 2011 at 01:12 PM
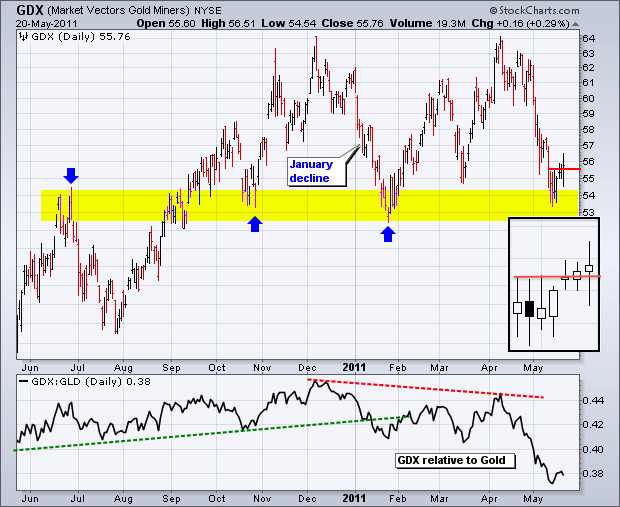
After getting slammed with a 10+ percent decline in May, the Gold Miners ETF (GDX) hit support and bounced over the last few days. As the chart below shows, this is no ordinary support level for GDX... Read More
ChartWatchers May 07, 2011 at 08:51 PM

Hello Fellow ChartWatchers! Believe it or not, StockCharts.com was founded 12 years ago on May 15th, 1999. To celebrate, we are running our Spring Special from now until the end of May. What is our "Spring Special"? I'm so glad you asked..... Read More
ChartWatchers May 07, 2011 at 08:20 PM
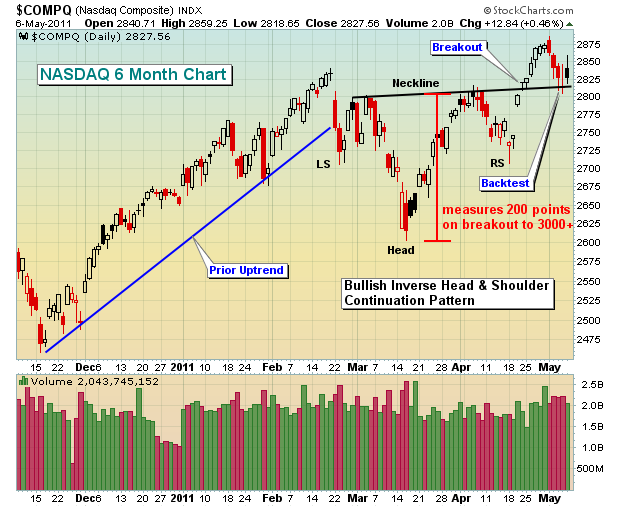
It was a little more than one year ago - in April 2010 - that I began warning about a potential top approaching. We now know what happened in May and June of that year... Read More
ChartWatchers May 07, 2011 at 04:01 PM
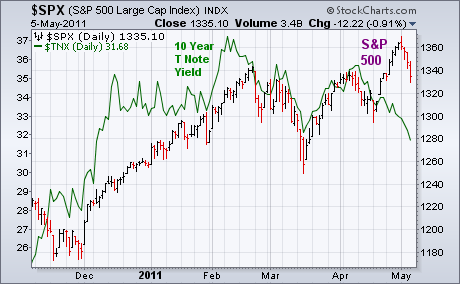
Bonds have benefited from the plunge in commodities. Several bond ETFs have rallied to the highest levels in months. Rising bond prices are pushing bond yields lower. And that may be a warning for stocks... Read More
ChartWatchers May 07, 2011 at 03:54 PM
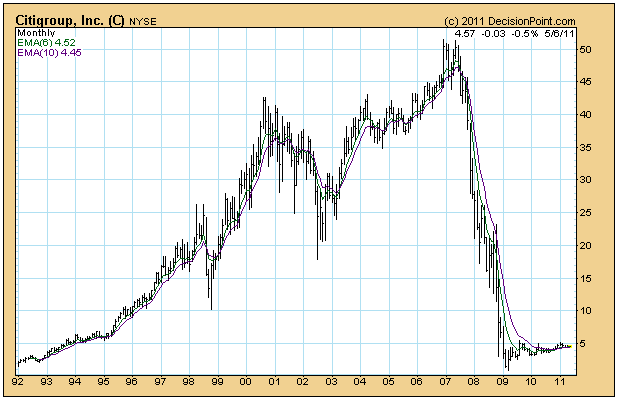
On Monday, May 9, Citigroup (C) stock will undergo a 10-for-1 reverse split. What this means is that 10 shares of C will be merged into one share, and holders of C will own one-tenth as many shares, but each share will be worth ten times the value of pre-split shares... Read More
ChartWatchers May 07, 2011 at 02:54 PM
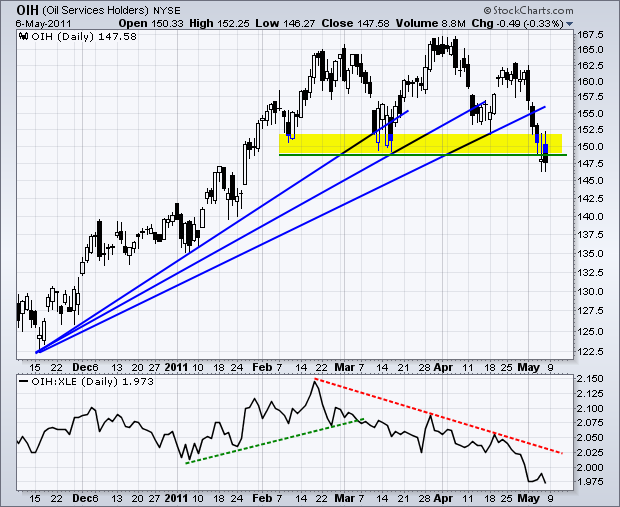
The Oil Service HOLDRS (OIH) is leading the energy sector lower with a break below the March lows. There are two bearish patterns working on the OIH price chart. First, OIH hit resistance in the 162.5-167... Read More