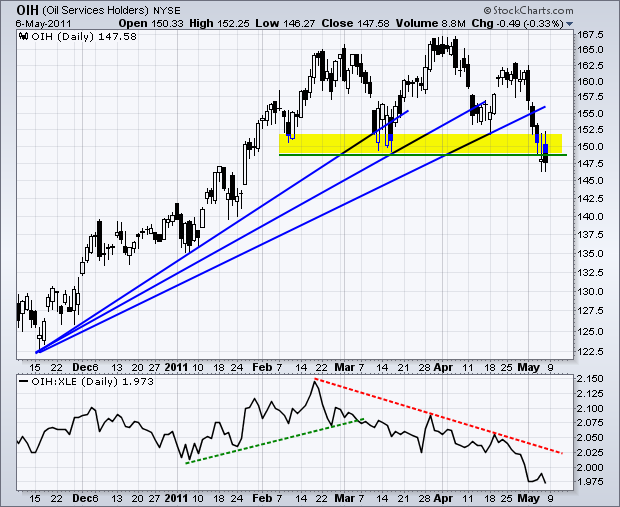
The Oil Service HOLDRS (OIH) is leading the energy sector lower with a break below the March lows. There are two bearish patterns working on the OIH price chart. First, OIH hit resistance in the 162.5-167.5 area with three reaction highs and then broke below support with a sharp decline this week. Even though a picture perfect triple top or head-and-shoulders pattern did not emerge, the essence of a distribution and breakdown is clearly there. Second, the ETF broke the third of three fan lines with this week's decline. These successive breaks affirm an increase in selling pressure leading to the breakdown.

Click this image for a live chart.
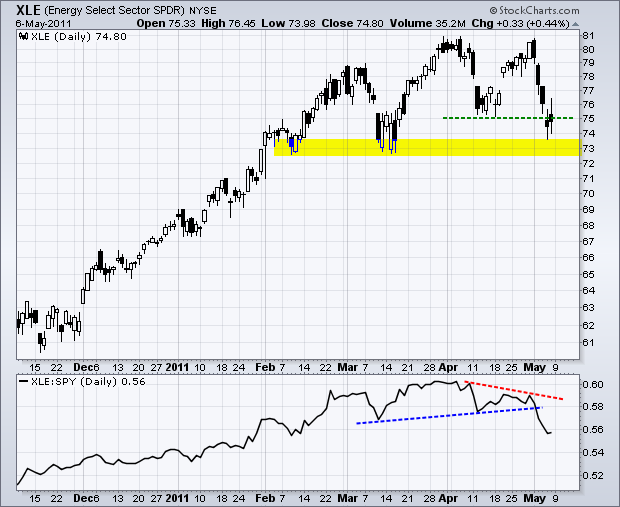
The indicator window shows the OIH:XLE ratio plot. OIH outperforms when this ratio rises and underperforms when this ratio falls. Also known as the Price Relative, this ratio peaked in late February and moved to multi-month lows this week. All told, the medium-term outlook for the Oil Service HOLDRS has turned bearish with this week's technical signals. The late April highs mark the first resistance area to watch for a reassessment. For reference, the second chart shows the Energy SPDR (XLE) breaking double top support this week, but still above the February-April lows.

Click this image for a live chart.
