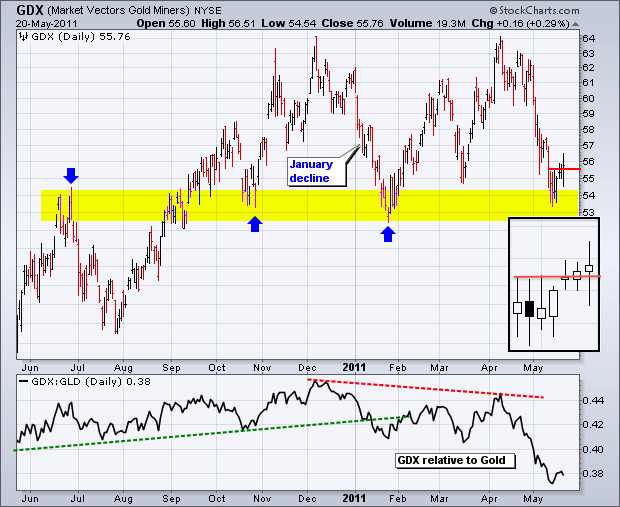
After getting slammed with a 10+ percent decline in May, the Gold Miners ETF (GDX) hit support and bounced over the last few days. As the chart below shows, this is no ordinary support level for GDX. Support in the 53 area stems from broken resistance and at least two reaction lows (October-January). There is also a reaction low around 55 in mid March. The ETF is finding some buying interest at support with a bounce the last few days. The black box highlights the last seven daily candlesticks. The first two are **spinning tops**, which affirm support. There was a mini-breakout with the move above the spinning top highs. Failure to hold last week's low would be put the big support zone in jeopardy again. The second chart shows the **Junior Gold Miners ETF (GDXJ)** testing support from reaction lows extending back to mid November.


Click these images for live charts.
