ChartWatchers September 20, 2009 at 01:53 AM
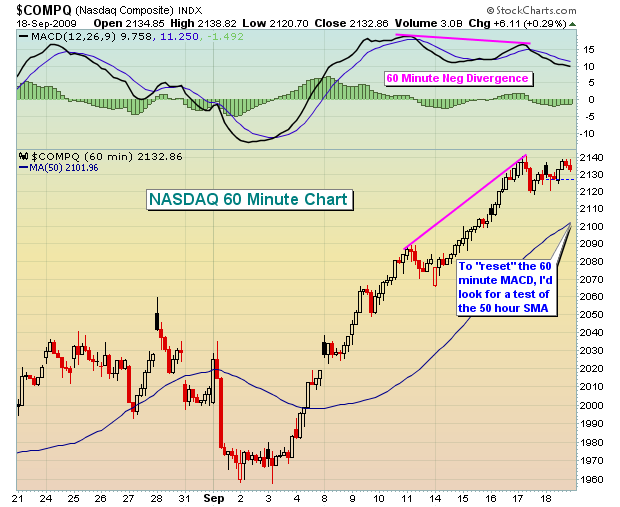
In a perfect world, we'd all invest every dime in winning stocks each and every trading day. Unfortunately, I haven't seen that kind of trading world yet. So as we approach each day, we must assess the risks in the market and determine an appropriate trading strategy... Read More
ChartWatchers September 20, 2009 at 01:49 AM
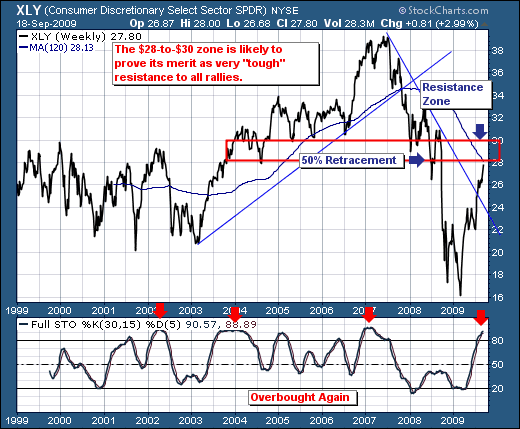
The insatiable need to own stocks has manifested itself in most S&P sectors, in which the Consumer Discretionary sector is doing far better than anyone can believe... Read More
ChartWatchers September 20, 2009 at 01:44 AM

Arthur Hill reviewed some standard intermarket relationships on Thursday. One of the best known is the inverse relationship between the U.S. Dollar and commodity prices. That's why a falling dollar has had a bullish impact on commodity prices since the spring... Read More
ChartWatchers September 19, 2009 at 04:05 PM
Hello Fellow ChartWatchers, We're taking a break from our on-going Technical Analysis 101 series to give you an update on the two disruptions that happened last week. I want to make sure everyone understands what happened and what we are doing to prevent it from happening again... Read More
ChartWatchers September 19, 2009 at 10:00 AM
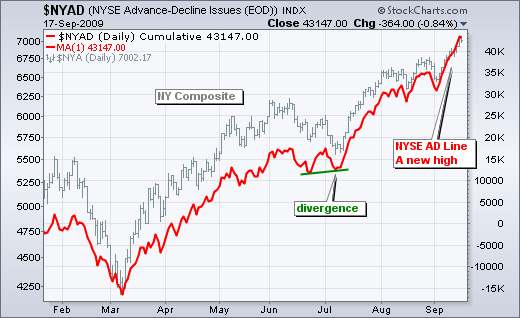
With a surge over the last two weeks, the AD Line and AD Volume Line for the NYSE hit new reaction highs. The first chart shows the NYSE AD Line moving above its August highs with a sharp advance this month... Read More
ChartWatchers September 18, 2009 at 06:30 PM
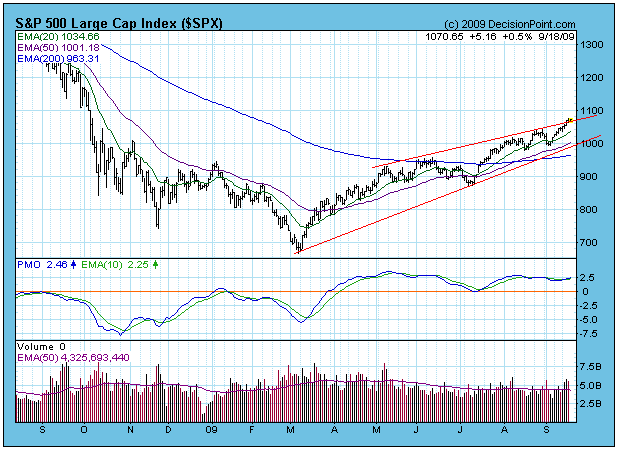
For weeks we have been looking for a correction, and a time or two we experienced some trepidation that the bull market might be over, but all the market has done is produce a series of minor pullbacks... Read More
ChartWatchers September 06, 2009 at 04:55 PM
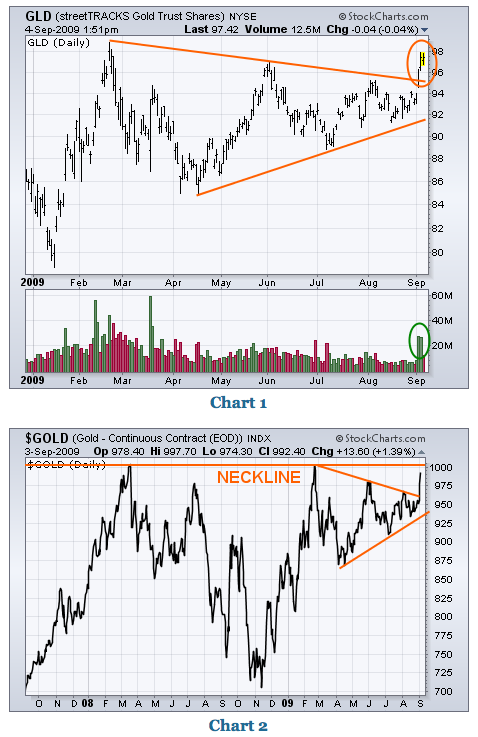
GOLD TESTING ALL-TIME HIGH... Last Friday I wrote about the bullish potential in gold and gold shares. That optimism was based on two bullish chart patterns which are shown below. The first is the bullish symmetrical triangle shown in Chart 1 for the Gold Trust ETF (GLD)... Read More
ChartWatchers September 06, 2009 at 03:01 PM

This is the next part of a series of articles about Technical Analysis from a new course we're developing. If you are new to charting, these articles will give you the "big picture" behind the charts on our site... Read More
ChartWatchers September 06, 2009 at 02:11 PM
Richard will return for our next issue... Read More
ChartWatchers September 06, 2009 at 02:05 PM
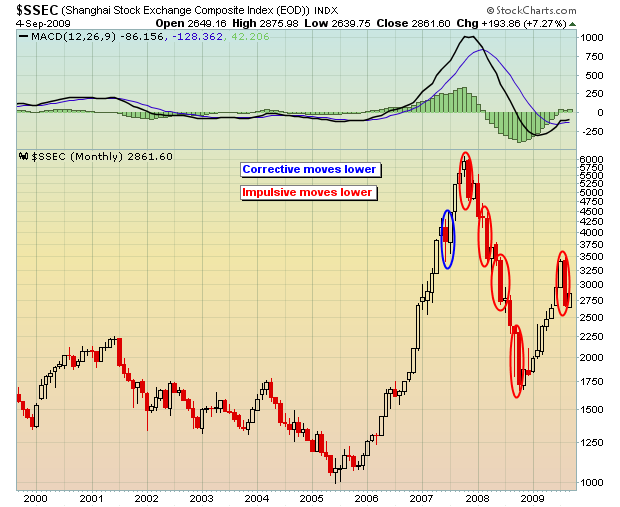
China's Shanghai Composite index is swinging wildly in both directions, reminiscent of the 1999-2002 moves by the NASDAQ. From a long-term perspective, you can clearly see that trends in both directions have been exaggerated... Read More
ChartWatchers September 06, 2009 at 01:56 PM
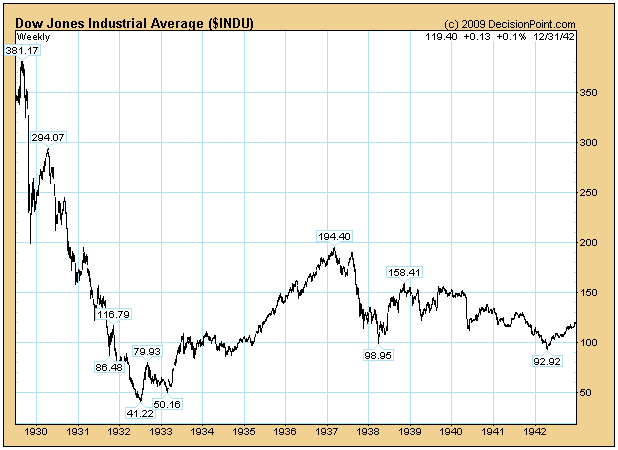
I continue to get mail from people who question how it is possible to be bullish in the face of the worst fundamentals since the Great Depression, so I thought it would be useful to look at a chart of the 1929 Crash and the decade that followed it... Read More
ChartWatchers September 04, 2009 at 01:49 PM
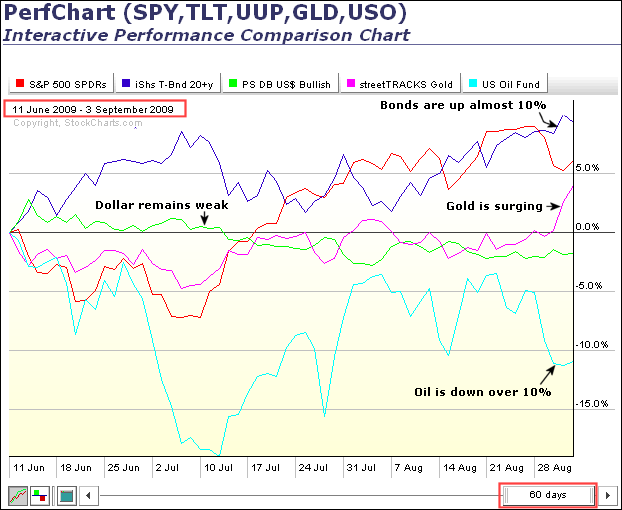
Intermarket analysis shows strength in bonds and gold, but weakness in the Dollar and oil. Strange days indeed. The Intermarket Perfchart below shows performance over the last sixty days, from June 11th to September 3rd... Read More