In a perfect world, we'd all invest every dime in winning stocks each and every trading day. Unfortunately, I haven't seen that kind of trading world yet. So as we approach each day, we must assess the risks in the market and determine an appropriate trading strategy. At times, it makes good sense to go "all in". But most of the time, the nature and size of our trades should be based on the risks inherent in the market. I've discussed some caution of late and I maintain it. It doesn't mean the market cannot go higher and that you cannot trade on the long side. It simply means you should do so much more selectively and with stops in place.
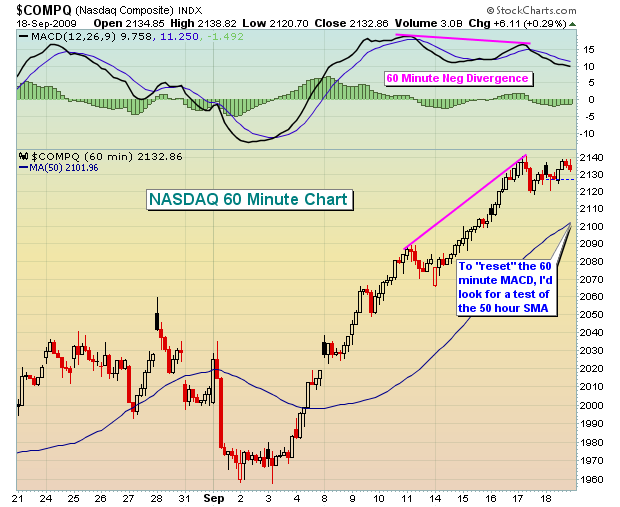
The good news is that price/volume trends remain very strong and this indicator is the most important of all, bar none. There's a laundry list of negatives that we must respect though. The MACD has been negative on the daily chart across all of our major indices for the last 3-4 weeks. There's also a negative divergence on the 60 minute charts, as the NASDAQ chart below shows:
Stochastics and RSI are both near-term overbought across our indices as well. They could use a pullback to help consolidate recent gains. Without a pullback, the overbought conditions last longer and generally encourage a steeper selloff when one finally occurs. I'd prefer to see a little unwinding of these oscillators now rather than later. Historically, we've entered the third worst period of the year on the S&P 500. Only one week periods in October and July have produced worse results historically than the period we're in. So far, this period is holding up well, but we have another week or so to negotiate before we can call it a success.
Finally, and perhaps most importantly, the masses are jumping into equity options on the call side. This is a MAJOR warning sign to me as retail traders, unfortunately, rarely walk away with the pot of gold. The Friday that options expire usually carries very heavy volume on both the equity call and equity put side. I tend to follow the equity call and put activity on days other than option expiration Fridays. In early May, I saw record levels of equity calls traded. In fact, May 7th (this day marked the top for awhile) held the record for most equity calls traded on a non-option expiration Friday. When longs start to believe the market cannot go lower, it does. The May 7th record of equity calls traded was broken this past Wednesday, September 16th, then challenged again on Thursday. I'm seeing way too much complacency in the market. I've seen many in the media saying that no one believes the market can go higher, therefore it will. While that's nice to say, I simply can't find proof of that by looking at options. I'm seeing the exact opposite - equity option traders don't believe the market can go DOWN. That ALWAYS makes me nervous.
Can the market go higher from here? Absolutely, and without a trace of pullback too. Overbought can stay overbought. There are NO guarantees in the market. Would I be "all in" expecting that continued bullish behavior? Absolutely NOT. The risks are too high. I believe you have to be very, very selective in trading the market at this level. While shorting has been a practice in futility for several months, the money has been made on the long side during this stretch. I continue to look for the stocks with the very best volume trends, suggesting accumulation. The best time to enter those stocks is either just as they make a new breakout on confirming volume OR on a pullback to retest a previous breakout level or a major moving average. Personally, I prefer the latter as risks are better and more easily controlled. One feature that we've added at Invested Central over the past 6-7 weeks is a Chart of the Day. These charts are designed to be highly educational and they focus on finding candidates that possess many of the reward to risk characteristics that I look for. You can check these charts out daily at CLICK HERE.
During our national radio broadcast, we discuss the Chart of the Day as well at 8:42am EST. CLICK HERE to follow us LIVE on the air each and every trading day from 8:00am-10:00am Monday thru Friday.
Happy trading!

