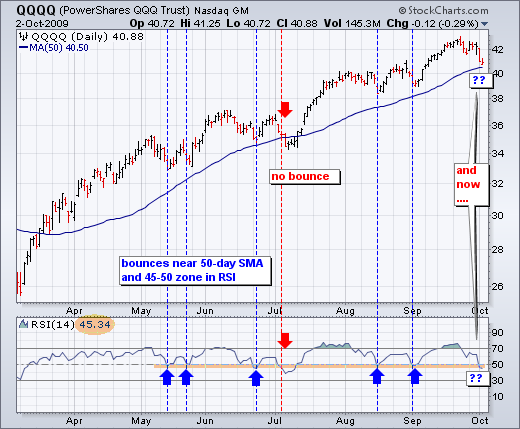
With a sharp decline over the last eight days, the Nasdaq 100 ETF (QQQQ) is testing support from the rising 50-day moving average and RSI is testing support around 45-50. QQQQ broke the 50-day moving average briefly in July, but held the 50-day during the May, June, August and September pullbacks. Some bounces were bigger than others, but the moving average held for the most part. A clean break below the 50-day would be negative for the current uptrend.

Click this chart for more details.
The bottom indicator window shows 14-day RSI. Notice the support zone around 45-50. RSI held this support zone in May, June, August and September. Again, the only breach of support occurred in July (red arrow). This also coincided with the breach of the 50-day moving average. With RSI again in this support zone, a momentum test is upon us. Failure to hold this zone would be negative for momentum and possible signal the start of an extended correction.
