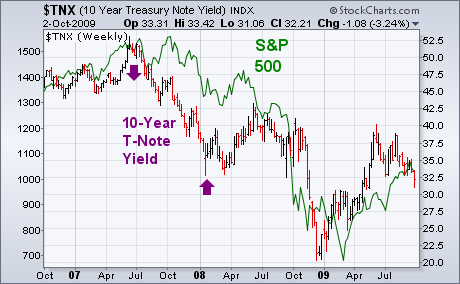
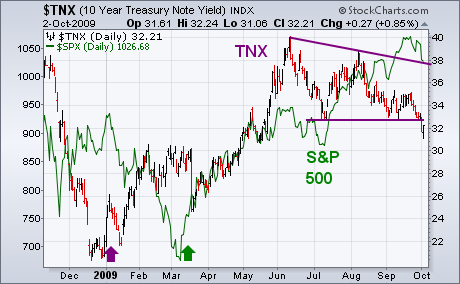
One of the catalysts behind Thursdays heavy stock selling was the breakdown in Treasury bond yields. The 10-Year T-note yield fell below its July low to the lowest level in more than four months. Bond yields are an indicator of confidence in the economy. When investors are optimistic, they buy stocks and sell Treasuries. That pushes bond yields higher. When they're more pessimistic, they sell stocks and buy Treasuries. That pushes yields lower. So the direction of Treasury bond yields has some bearing on the direction of stocks. That's been especially true over the last two years. The weekly bars in Chart 1 compare the trend of the 10 Year Treasury Note Yield (TNX) to the S&P 500 (green line). At least two things are apparent. One is that bond yields and stocks have usually trended in the same direction. The second is that bond yields have tended to change direction first. Bond yields started dropping during the summer of 2007 several months before stocks peaked. Bond yields started bouncing at the start of 2008 and anticipated a stock rebound that spring. After falling together during the second half of last year, bond yields turned up several months before stocks. Chart 2 shows bond yields turning up in January of this year two months before stocks' March bottom. Bond yields peaked in June, however, and have been weakening since then while stock prices have risen. That "negative intermarket divergence" grew more serious with yesterday's breakdown in yields.


