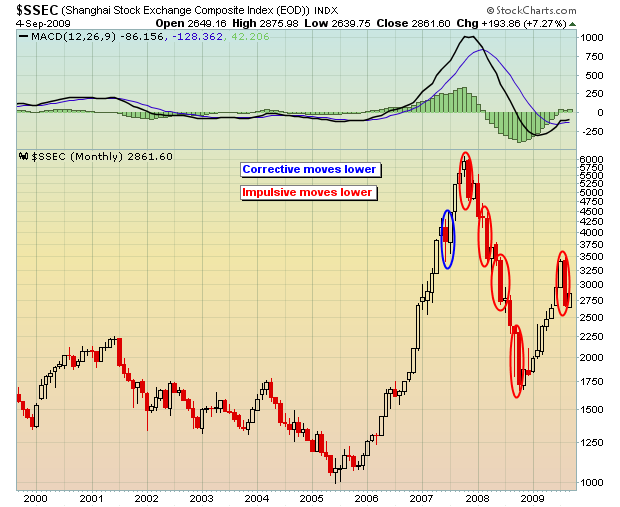
China's Shanghai Composite index is swinging wildly in both directions, reminiscent of the 1999-2002 moves by the NASDAQ. From a long-term perspective, you can clearly see that trends in both directions have been exaggerated. Any time that we've seen impulsive moves in one direction or the other, we have seen follow through in that same direction. From the mid-2005 to mid-2007, the impulsive moves were up while the corrective moves were down. From the peak in 2007, just the opposite occurred with impulsive moves lower. Take a look at the chart below and study the monthly swings in this index from mid-2005 up until now:

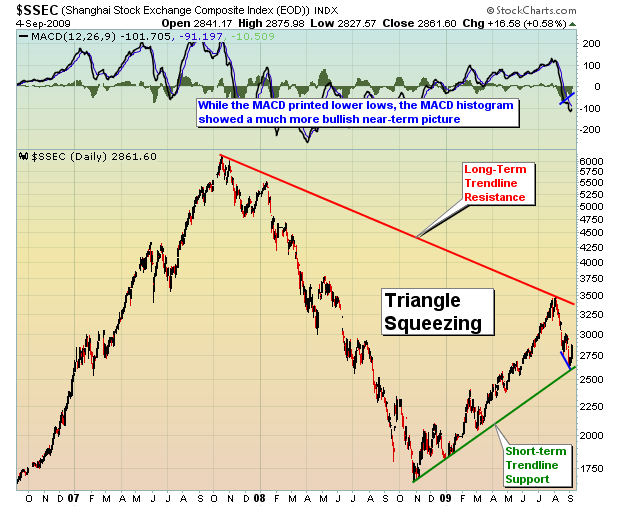
It's impossible to ignore that impulsive move down last month. Thus far in September, the Shanghai is rebounding. Will it last? Well, some of the short-term strength was suggested by the MACD histogram on the daily chart, which printed a positive divergence on the latest move lower in China. The chart below is a three year chart and it shows the positive divergence on the MACD histogram and a triangle formation to keep an eye on:

The MACD histogram measures the distance between the MACD (thick black line) and its 9 day moving average (thin blue line). So while prices were falling on the Shanghai and the MACD found new lows as well, the MACD histogram indicated that the MACD was not dropping as fast as its 9 day moving average, an early hint of an impending reversal if you will. I prefer to see the positive divergence develop on the MACD, but I do take note of divergences on the histogram as well.
The Shanghai gained over 100% off of its October 2008 lows and started its climb well before the S&P 500 bottomed. I find the sudden drop in Chinese shares somewhat alarming and would feel much better about the S&P 500 if the Shanghai breaks out of its current triangle to the upside. Could the recent fall in China be a precursor to another quick drop here in the U.S.? Well, I wouldn't rule it completely out, though we must remain focused on the here and now, not what could be. So long as the major indices in the U.S. continue their uninterrupted climb and key price support levels are not lost, then I assume pullbacks can be bought. Personally, I'd like to see additional selling on the U.S. indices down to their 50 day SMAs, a drop that would in my opinion reset the MACDs near the centerline and provide a better opportunity for another upside move. A breakdown below the 50 day SMAs on increasing volume should absolutely be respected.
Price/Volume trends have remained bullish for the last several months. However, that did begin to change over the last week as heavy volume accompanied selling after good fundamental news had been reported - ie, Intel's (INTC) raised guidance, higher pending home sales, much higher ISM reading. As I always like to say, it's not the news that I focus on. It's the market's REACTION to the news that's important. I am short-term neutral to slightly bearish, while bullish the intermediate-term. September has finished lower 35 of the last 58 years on the S&P 500, the only calendar month to finish down more than up since 1950. It is the worst month of year, bar none. History can, and many times does, repeat itself, so tread and trade lightly.
Happy trading!
