ChartWatchers December 09, 2006 at 11:06 PM
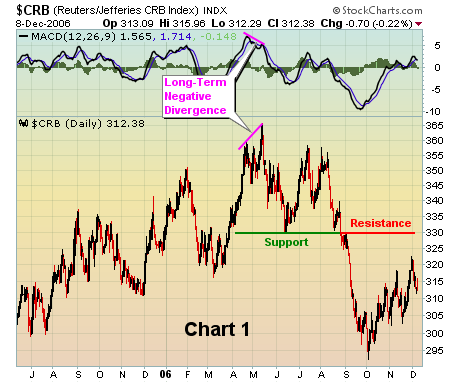
We've seen commodity prices skyrocket over the past several years and equities that have exposure to commodities have gone along for the ride... Read More
ChartWatchers December 09, 2006 at 11:05 PM
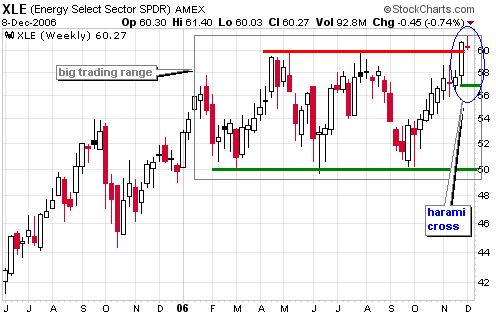
The Energy SPDR (XLE) surged over the last two months and is challenging resistance, but the U.S. Oil Fund ETF (USO) remains relatively weak and continues testing support. These two are out of sync and something has to give... Read More
ChartWatchers December 09, 2006 at 11:04 PM
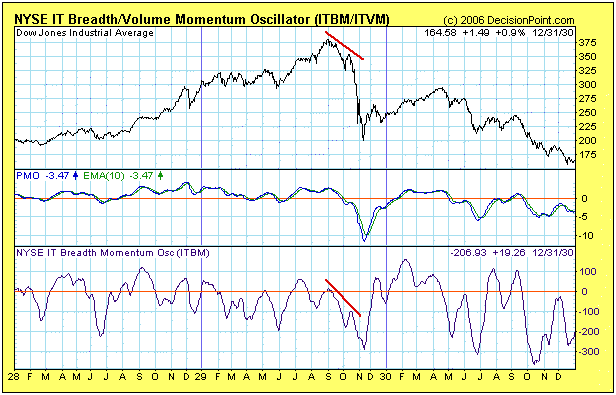
I have heard that a number of people have been predicting a crash. I don't know what evidence they are citing, but my analysis of the price structure and internal indicators leads me to the conclusion that there is not a crash anywhere in sight... Read More
ChartWatchers December 09, 2006 at 11:03 PM
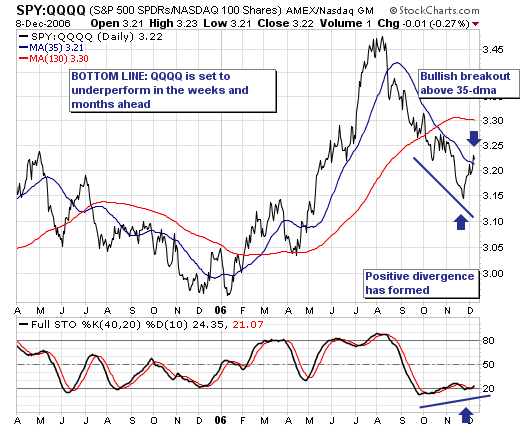
The recent "slowdown" in the major averages has produced "rotational undercurrents" between these averages; the most poignant we observe is the bullish breakout in the ratio of the S&P 500 Spyders (SPY) and the NASDAQ 100 (QQQQ)... Read More
ChartWatchers December 09, 2006 at 11:01 PM
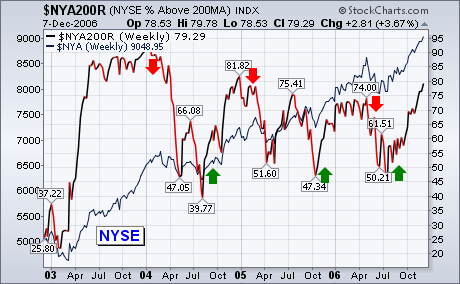
% NYSE STOCKS ABOVE 200-DAY AVERAGES ... I've received requests to look at some long-term market sentiment indicators. I've chosen a couple that you can plot by yourself on Stockcharts. One of those is the % of NYSE stocks above their 200-day moving average ($NYA200R)... Read More
ChartWatchers December 09, 2006 at 11:00 PM
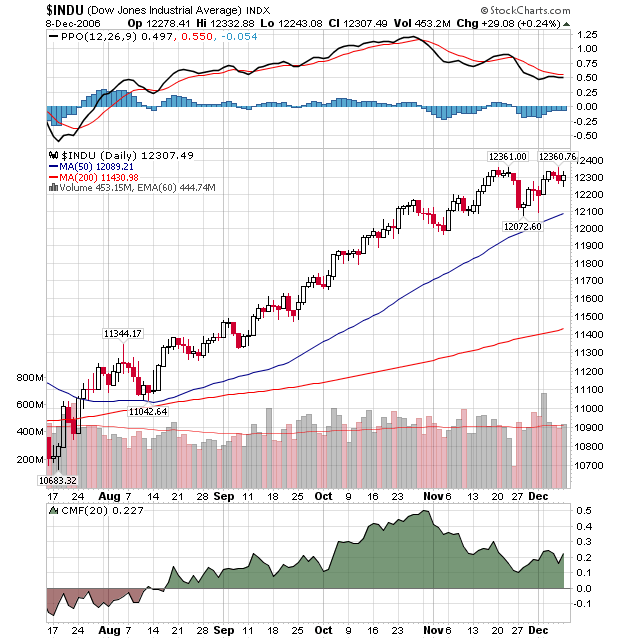
The Dow Jones Industrial Average had a significant technical development in the middle of last week when it failed to surpass it's previous "peak" for the first time in months. After hitting 12,361 on November 22nd, the index sank to 12,072 a week later... Read More