I have heard that a number of people have been predicting a crash. I don't know what evidence they are citing, but my analysis of the price structure and internal indicators leads me to the conclusion that there is not a crash anywhere in sight. This does not preclude a crash triggered by an external event of which we can have no advance knowledge, but the visible deterioration that typically precedes a crash does not currently exist.
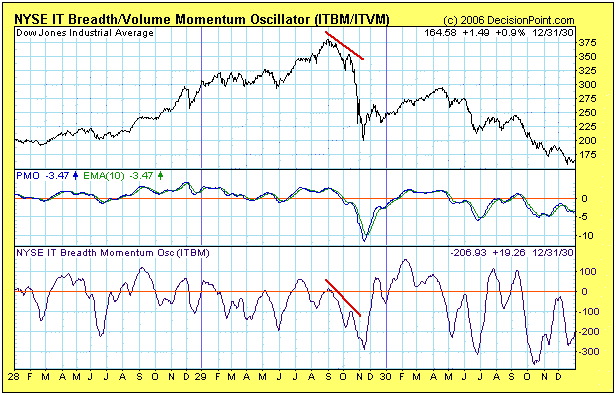
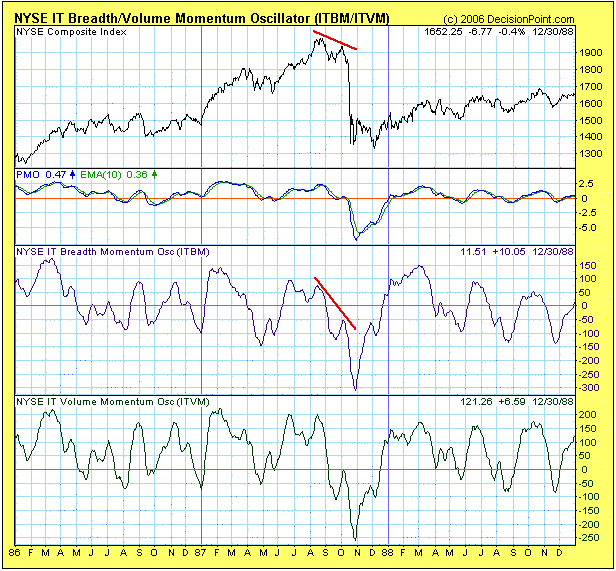
To illustrate, we can look at charts (below) of the two most famous crashes of the last 80 years – the Crash of 1929 and the Crash of 1987. There are two chart configurations that preceded these two major crashes. First, was the price action – a major price top, followed by a lower top, followed by a break below the price low between the two tops. This kind of event doesn't always lead to a major crash, but it is always a sign of danger, and can be part of a market correction.
The second element is internal deterioration visible in a breadth indicator. In the case of the two charts below we can see that, when the second price top formed, the ITBM Oscillator also topped, and it topped below the zero line as a result of an extended period of deterioration. Below zero indicator tops are another danger sign that should not be ignored.


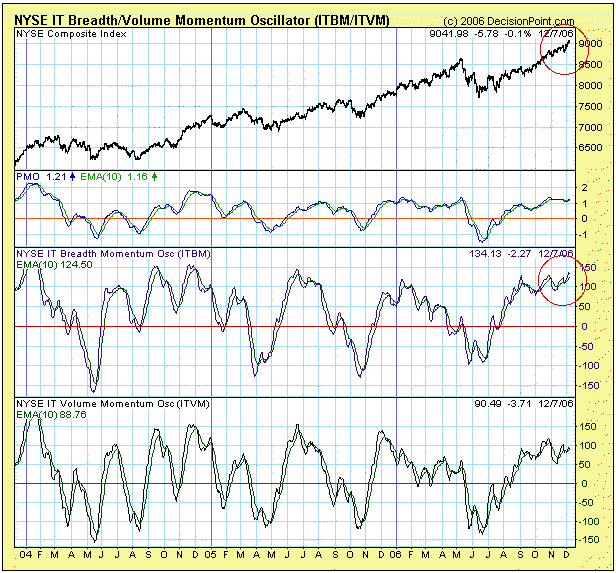
The next chart shows the current market status. The market is clearly overbought, but prices are making new highs, and the ITBM does not reflect any serious deterioration. The market is definitely due for a correction, but, other than the overbought condition, there is scant evidence that a correction, let alone a crash, is definitely about to occur.

Bottom Line: History shows us that structural crashes do not materialize out of thin air. That is to say, if the market is making new highs, it will take several weeks or months after the final top to allow for sufficient deterioration before the bottom falls out.
