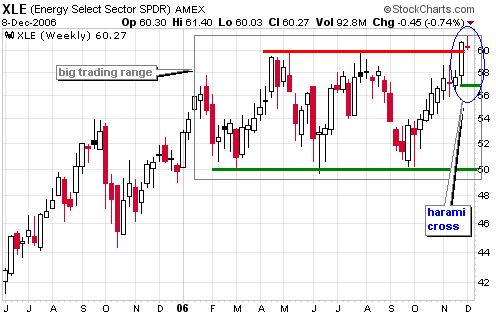
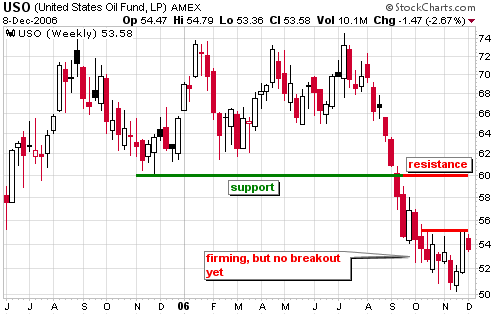
The Energy SPDR (XLE) surged over the last two months and is challenging resistance, but the U.S. Oil Fund ETF (USO) remains relatively weak and continues testing support. These two are out of sync and something has to give. As I see it, either XLE will fail at resistance and pull back to trading range support or USO will break resistance and confirm the surge in XLE.
The Energy SPDR (XLE) broke above trading range resistance at 60 in late November and this is bullish. The breakout occurred with a long white candlestick and the ETF stalled this past week with a doji. The last two candlesticks form a harami cross and this is a potentially bearish candlestick reversal pattern. A move below the low of the long white candlestick (57) would confirm this pattern and target a decline back to trading range support. As long as the breakout at 60 holds, the trend is up and XLE remains in bull mode.

The U.S. Oil Fund ETF (USO) declined to support at 50 and firmed over the last two months. The ETF surged at the end of November with a long white candlestick and is challenging resistance from the mid October high. USO then pulled back this past week and formed a small black candlestick. The ETF remains short of a breakout and needs to clear last week's high (55.21) to trigger a bullish signal. This would target a move to broken support around 60. A breakout would confirm strength in XLE and failure to breakout will likely weigh on XLE.

