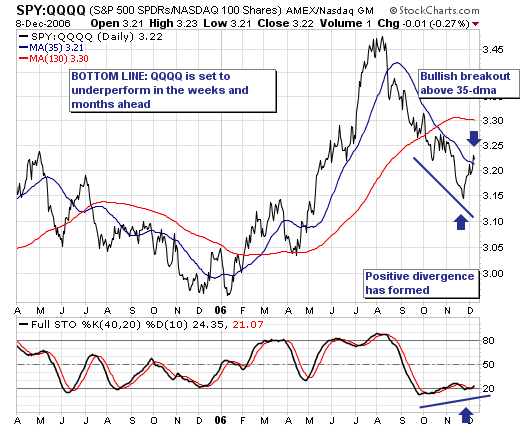
The recent "slowdown" in the major averages has produced "rotational undercurrents" between these averages; the most poignant we observe is the bullish breakout in the ratio of the S&P 500 Spyders (SPY) and the NASDAQ 100 (QQQQ). The reason we focus upon this is that it has implications in terms of traders taking on risk; in a normal bull run, traders tend to put on high-beta technology shares to increase returns above the market. Hence, when we begin to see strength in the ratio - it implies traders are shunning risk, which suggests a potential trend change is in the very near future. Perhaps it is merely a correction; perhaps it is something larger and deeper. History will be the final arbiter.
Technically speaking; the ratio chart has now broken out above it's shorter-term 35-day moving average, which given the 40-day stochastic is exhibiting positive divergences with the ratio...further suggests the ratio is headed higher. The real question is whether the more intermediate-term 130-day halts the rise and turns the ratio lower to new lows. In any case; it is our opinion that tactical short positions can now be considered with a greater probability of success than in recent months.

