ChartWatchers June 17, 2006 at 10:05 PM
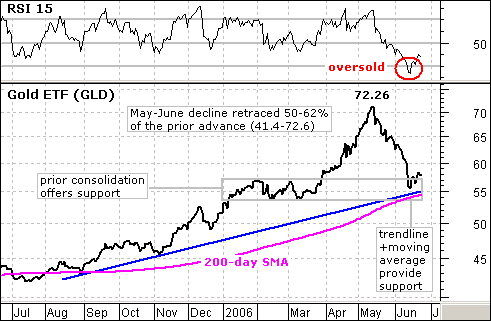
After a harrowing decline the last 5-6 weeks, the StreetTracks Gold ETF (GLD) finally reached a support zone and RSI became oversold. This paves the way for a bounce and possibly a continuation of the long-term uptrend... Read More
ChartWatchers June 17, 2006 at 10:04 PM
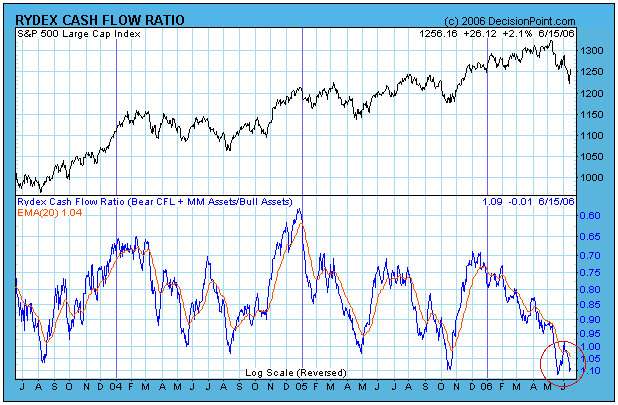
(Editor's Note: This article was written on June 16th - over a week ago. Given the market's sideways motion since then, the article's basic premise remains valid... Read More
ChartWatchers June 17, 2006 at 10:03 PM
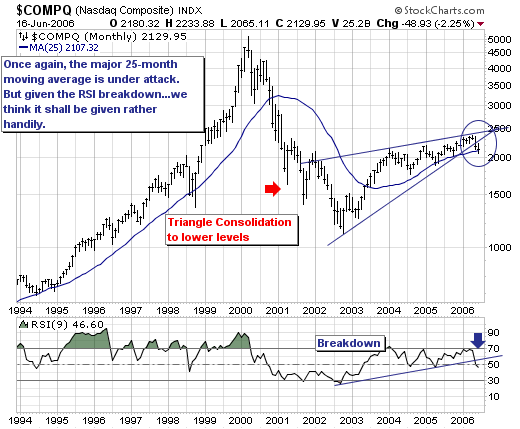
The NASDAQ Composite is now in danger embarking on an extended move lower... Read More
ChartWatchers June 17, 2006 at 10:01 PM
READING MY LIPS ... On Tuesday June 13, I gave a speech to traders on the New York Board of Trade. I used that opportunity to review the major intermarket principles relating to the dollar, commodities, bonds, and stocks... Read More
ChartWatchers June 17, 2006 at 10:00 PM
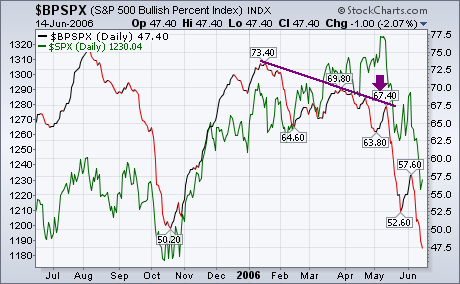
"Summer-time... and the trading's easy!" Sorry for the singing folks, but we are in a happy mood here at StockCharts right now. Summer time always cheers people in the Pacific Northwest up (I wonder why? ;-)... Read More
ChartWatchers June 03, 2006 at 10:05 PM
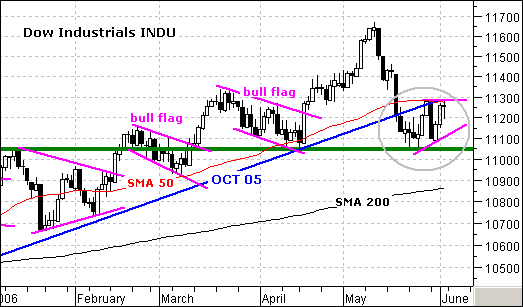
The Dow came down hard in May, but found support at 11050. This support level stems from January resistance and the April low. A key tenet of technical analysis is that broken resistance turns into support... Read More
ChartWatchers June 03, 2006 at 10:04 PM
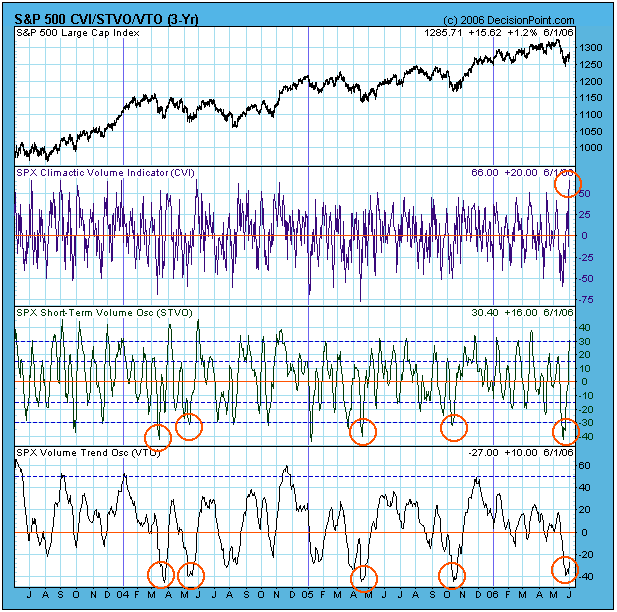
On Tuesday we saw the market successfully retest last week's lows, then on Thursday there was a climactic rally that broke above last week's highs. This was a lot more positive than many people (including me) were expecting... Read More
ChartWatchers June 03, 2006 at 10:03 PM
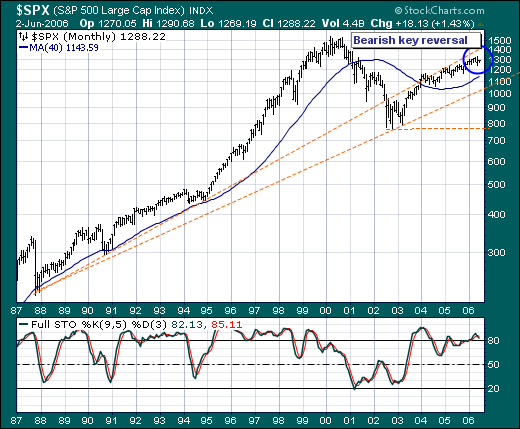
The May Swoon as we are apt to call weakness seen during the month had led to an increase in confusion amongst technical analysts... Read More
ChartWatchers June 03, 2006 at 10:02 PM
SERVER UPGRADE COMPLETED - We hit another major milestone last week when we upgraded our final database server... Read More
ChartWatchers June 03, 2006 at 10:01 PM
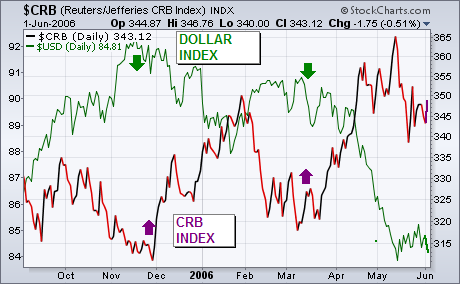
The chart below compares the Dollar Index (green line) to the CRB Index (purple line) since last September. The main message to be drawn from the chart is that the two markets have been trending in opposite directions which is their natural tendency... Read More
ChartWatchers June 03, 2006 at 10:00 PM
The results are in! We have the five winners for our "Seeing Clearly with SharpCharts2" contest! Thanks again to everyone that entered. There were over one hundred entries and all of them were very well done. The judges' job was not easy at all... Read More