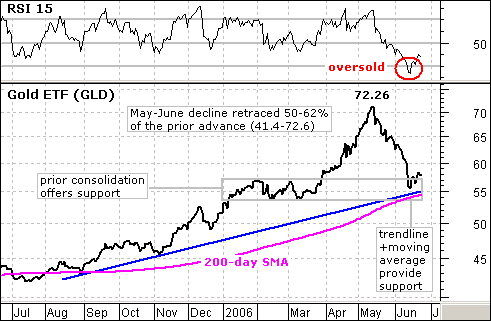
After a harrowing decline the last 5-6 weeks, the StreetTracks Gold ETF (GLD) finally reached a support zone and RSI became oversold. This paves the way for a bounce and possibly a continuation of the long-term uptrend.
A number of technical items have come together to mark support around 55. First, the rising 200-day moving average currently sits at 54.16. The fact that GLD is above this moving average and that the moving average is rising is long-term bullish. Second, the January to March consolidation provides a nice support zone between 53.5 and 57. Third, the blue trendline extending up from the August low extends to around 55 and acts as support. And finally, the current decline has retraced 50-62% of the prior advance (May-05 to May-06). Even though a classic correction pattern did not form, the distance of the retracement (50-62%) is normal for a correction.
In addition to evidence for support, 14-day RSI moved below 30 for the first time since 7-Jan-05. I should point out that GLD took another month to bottom in early 2005 and there was another support test at the end of May, over four months later. There was a short-term signal in February 2005 when RSI formed a positive divergence from early January to early February 2005 and moved above 50. The same could happen here and gold may need some time to base. Buying now is for bottom pickers and aggressive traders. The other option would be to wait for RSI to form a positive divergence and move above 50.

