In the Chapter 4 article, we were setting up new chartlists. If you are following along, it would be good to have completed that step before setting this step up. Now we get to create scans to fill the chartlists. In order to create custom scans, you need to have a membership level that enables this tool. On the top right of your stockcharts page, up beside your login id, is the -your account - link. If you click on there, you can see what your account level is. As you can see, you need to have an 'extra' level or above.
Go back to the members tab/ page. Scroll down to just above chartlists. You should see this - Your Saved Scans - Box.
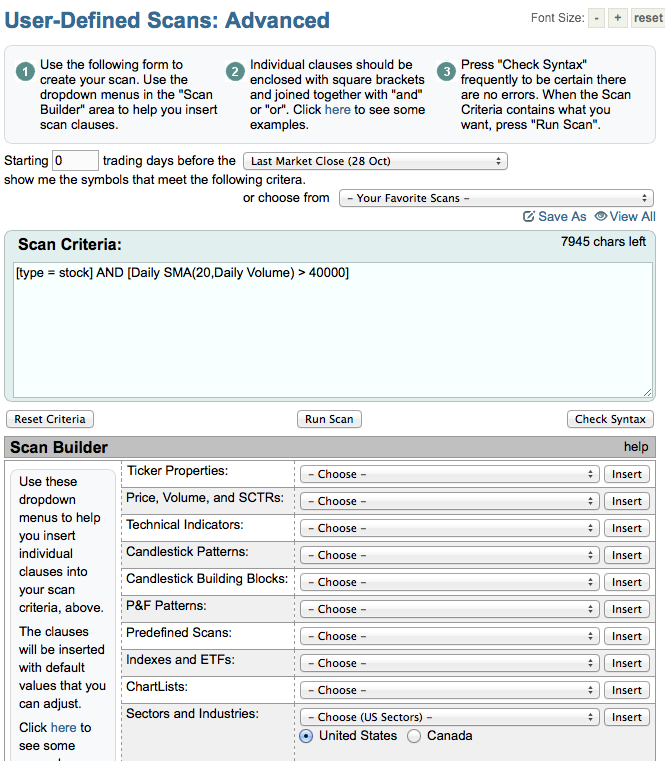
On the right hand side, is - Create a New Scan - link. When you click on it, it should take you to this page.
There are 5 parts to the page.
a) The 1-2-3 boxes.
b) The start date area and the intraday or last market close dropbox. If you miss doing your scan one day, this is an area you can run the scan on a different day. (how sweet is that!)
c) The drop down box shown on the right side - Your Favorite Scans - which is where we can Save, or select other scans from. When we have scans stored in there, we will have the option to delete here as well. We'll use this section today.
d) The big Scan Criteria area that we will put scan lines into. We'll use this section today.
e) The Scan Builder section with all the drop down boxes. This tool is so valuable as it has lots of the lines of code we need previously written so we just have to select it. We will use this section today.
So we need to start with a clean slate. We want to remove the items in the scan criteria box.
Just highlight them and delete them. When done we should have a clean slate.
First, lets add a comment line with the title of this scan. Comment lines always have to have 2 slashes or a hashtag to tell the scan engine that this is a comment line and ignore it when running the code.
We are going to start broad and then narrow our fields so the scans run fast. As an example, we don't want the computer to calculate the SCTR scores for every stock in the database and then narrow it to the $TSX stocks. We should narrow it to Canada or other groups first. Then the next line of code can do finer calculations. This speeds the scan up dramatically.
We will add a comment line telling us what the line of code is going to do. We can then go down to the Scan Builder box and select the Ticker properties - country - from the dropdown box as shown below. Click - Insert - on the right side to move it up to the scan criteria box.
When you click on insert, you should see something like this in the Scan Criteria box.
We have a few problems. It defaulted to country = US and it also starts with 'and' . Let's work on the 'and' problem first. The first - only the first - clause cannot start with 'and'. That is easy to fix. We remove 'and' and delete any spaces so the [ bracket is the first item in the row. While we are here, wherever there is a square [ bracket ], it has to be square style and it has to be a set. It can not be parenthesis brackets or something else. JUST SQUARE brackets around the whole expression.
Next, it says country is US. Well, we need to change this to Canada. Place your cursor up there, delete US and insert Canada.
Does yours look exactly like this ? Make sure your cursor is on a new line. Add the comment line.
// This line is defining which SCTR group we are working with.
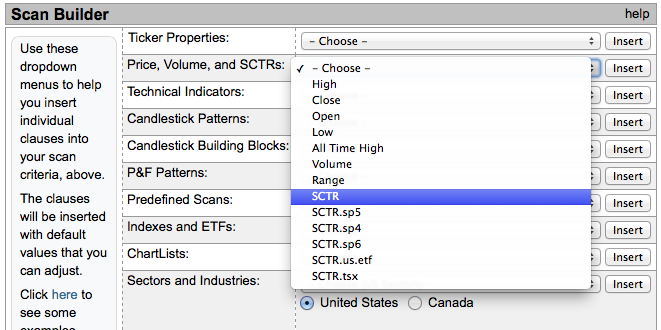
OK. Let's focus on the SCTR now. Under ticker properties, in the Scan Builder, choose the dropdown menu and select the scan criteria you want. So we don't want to select the general SCTR first. We want to select from one of the groups underneath it. I will use the SCTR.tsx for the example. If you are a US portfolio manager or investor, you may choose to select SCTR.sp5 for the SP500, SCTR.sp6 for the small caps, or the SCTR.sp4 for the midcaps. The SCTR.us.etf is the fabulous system for pointing out ETF's that are breaking out. ETF can also help you in your sector analysis. So whenever this example uses SCTR.tsx, substitute the group you want to scan within.
Now go down to the Scan builder and go to the second line with Price, Volume and SCTR.
Select the SCTR for what you want. I am selecting SCTR.tsx . Substitute yours in here.
Click insert.
Change the 90 to 75.
Excellent.
Let's add this comment line.
// End of scan
If anything is below this end of scan line, please delete it before continuing.
Remove any extra blank lines.
This is how mine looks.
// 6020 Top 25% List Scan
// This scan is just finding the strongest 25% of the stocks in our selected SCTR group.
// This is a very simple scan to write and run.
// This just defines which country we are focused on
[country is Canada]
// This line is defining which SCTR group we are working with and limiting to the best 25%
and [SCTR.tsx > 75]
// End of Scan
In Summary:
Your scan should have three different things starting the lines of code.
// for comment lines
[ - A square bracket for the first line of usable code.
and statement - starts with the word 'and' to continue the lines of scan codes.
Now we are going to make sure our work is correct. Click the check syntax box at the bottom of the Scan Criteria on your right. In the blue border it should say your syntax is correct. If it is ok, we are going to go to the top right above the Scan Criteria box and click 'Save as' just below the 'your favorite scans' dropdown list.We are going to save this scan with the same number as the chartlist we want to drop into. So this will be called the :
6020 SCTR Top 25% List Scan
Then click ok.
Finally, we get to run it.
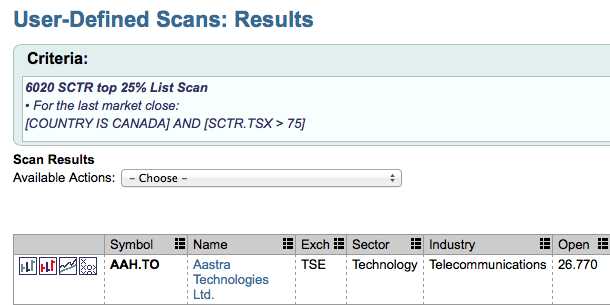
Now watch your tab names closely. When you click on run scan in the bottom centre of the Scan Criteria box, it may open a new tab with the results. So click run and you should get some results.
On the right hand side, it should tell you how many results came back. It was too far right to fit on this blog. The count might be 140 or something. It should not be small like 10, or large like 1000. If it is, one of the scans is wrong. You should be able to copy the scan information lines above straight into the box.
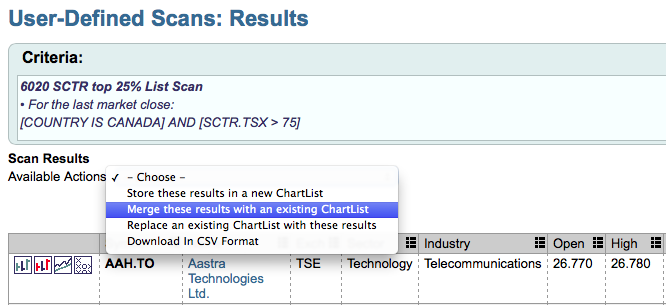
So, now you have scan results, but you have not moved them to the chartlist yet. So on the top left of the page, we are going to 'Merge then into an existing chartlist. The dropdown window appears and you can select where it says - please select a list - to use the chartlist with the same number as the scan. Now the name of the scan matches the chartlist to merge into. Select 6020 SCTR Top 25% List. Click ok and they will be merged into the list.
So the beauty of putting this scan list into a chartlist is the ability to look at the data in different views. At the top, you can change the summary dropdown to CandleGlance and look at the charts quickly.
You'll probably see that most charts are bottom left going up towards the top right!!! This is how we make money. The trend we want to continue has these traits!
So although the CandleGlance view might not be optimal yet, it gives you a broad view of the great stocks you are looking at. Up at the top, above the first chart is a line. You can select an indicator, so we will choose the SCTR line in the dropdown box beside the 'indicator' word. I would suggest changing the duration to the left of the indicator word to 6 months.
What I hope you see, is that when the stocks moved above 80, many of them did so for a long time. That is nice so you are not constantly flipping in and out of weak stocks.
Lets leave this blog here. The next blog in this series will talk about how to find these stocks as they break out, rather than when they already have run. So we made two other chartlist numbers 6022 and 6024. Our plan is to create two scans for each one of those.
Good Trading,
Greg Schnell, CMT


