In our first article we discussed an overview of the SCTR. In the second article, the focus was placed on the different concepts in relative strength. We covered off how the SCTR is calculated and how to plot it. In the third posting, we covered off the different aspects of the SCTR. Trading it from a long low base, what happens in the middle of the range and where the SCTR can become very interesting for investment timing.
In this article, the assembly of watchlists is important for managing the scans that we will use to find interesting timing on strong stocks.
So let's start with screen shots of creating new chartlists. Start on your members tab shown below in white.
On your members page, scroll down to the chartlist section.
On the Right hand side, click on - Create a New List as shown below.
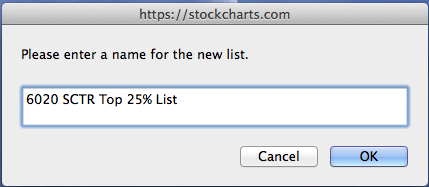
This is a picture of the chartlist create screen. Go ahead and create a chartlist with this number and name.
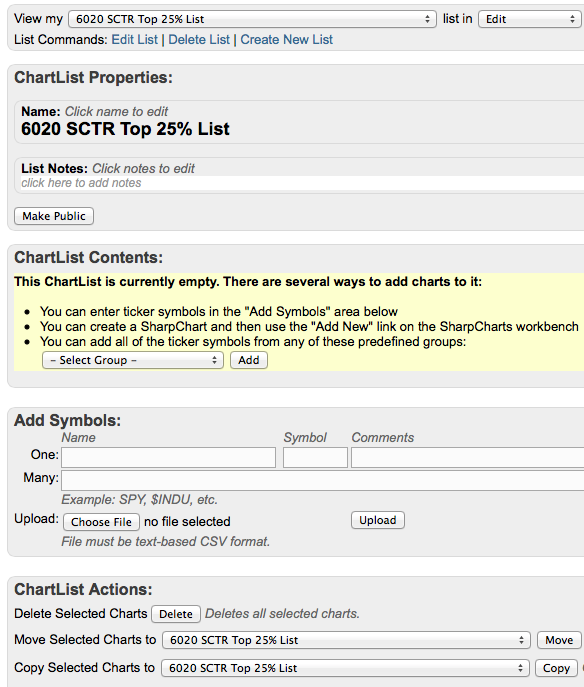
You should arrive on a page with this new chartlist created. Notice the yellow box that tells you the chartlist is empty. We will add charts to this list using scans.
We need to create four more chart lists with the following titles.
6021 - Quick Look Stocks Going Up - Nothing Permanent
6022 - SCTR Strong Stocks Moving Up
6023 - Quick Look Stocks Pulling Down - Nothing Permanent
6024 - SCTR Strong Stocks Puling Back.
We will use the chartlists starting with 6020, 6022 and 6024 to keep adding stocks into daily and over time they will fill up with quite a few stocks. This list will get a little long but that's ok. We will only 'Merge' stocks into these 3 groups. They are the even numbered chartlists.
The other 2, 6021 and 6023 are temporary. You may just dump stocks in to look at the new ones for the day. The next day we will Replace the stocks in that list so the old ones are gone.
So we have created 5 chartlists to put our scan results into each day. Once we set up the scans, you can run these scans from your desktop, iPad or iPhone and it only takes a minute. We'll set up the scan creation in the next chapter.
Good Trading,
Greg Schnell, CMT


