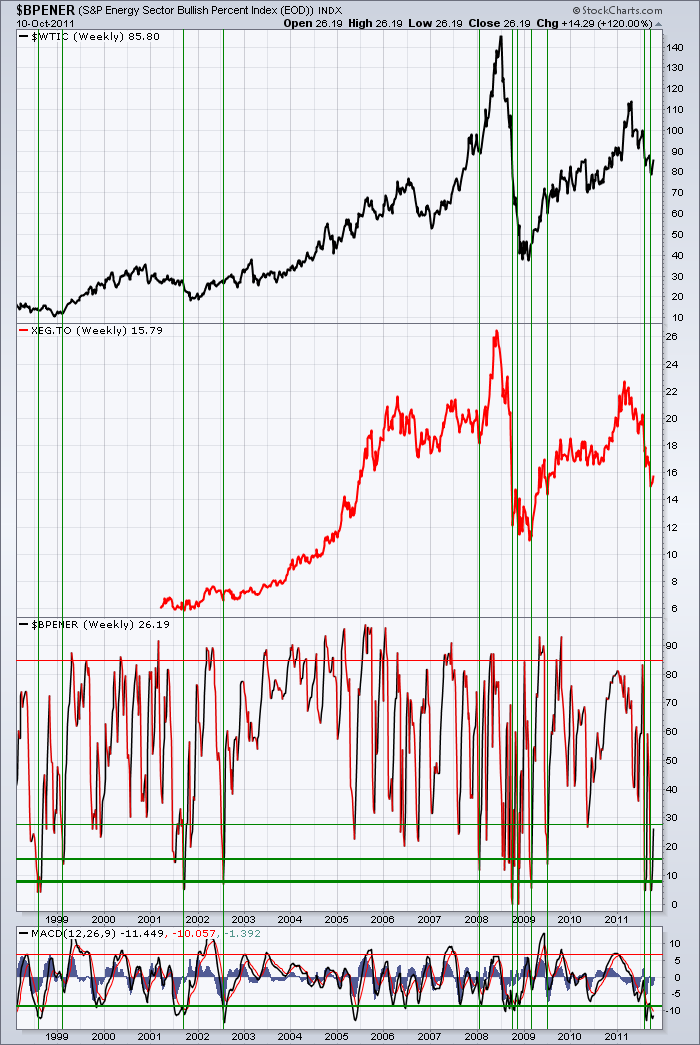
Today's comment is how oversold the energy sector is.
THe Bullish percent index is a measure of the % of stocks in a group that are on Point and figure buy signals. Buy Signals are stocks with a recent breakout above a previous column of x's.
Fore more on Calculations and explanations of Bullish Percents, see this article.
Take a look at the Energy sector Bullish percent Index.
When this level is above 80% it means the majority of stocks making new highs.
When it is greater than 50% it is an important place to look for rallies.
When it is below 20%, it is very weak. But once it starts turning up, it usually sees strong moves towards it from value investors.
Todays chart is a little busy, but follow the logic. On the chart is the Canadian XEG.TO - ETF. Now this Bullish percent calculation is actually off the US market, but it is important to use Canadian ETF's on the Canadian Technician's site!
Compare the location of the green lines on the chart with the price of $WTIC as well as the Bullish percent levels. Check the MACD levels, and how significant this low level is on the charts. This is a 13 year chart.
It may not mark the absolute bottom, but it does mark an excellent entry point (with a stop!)
You can click on the chart for a very large version.
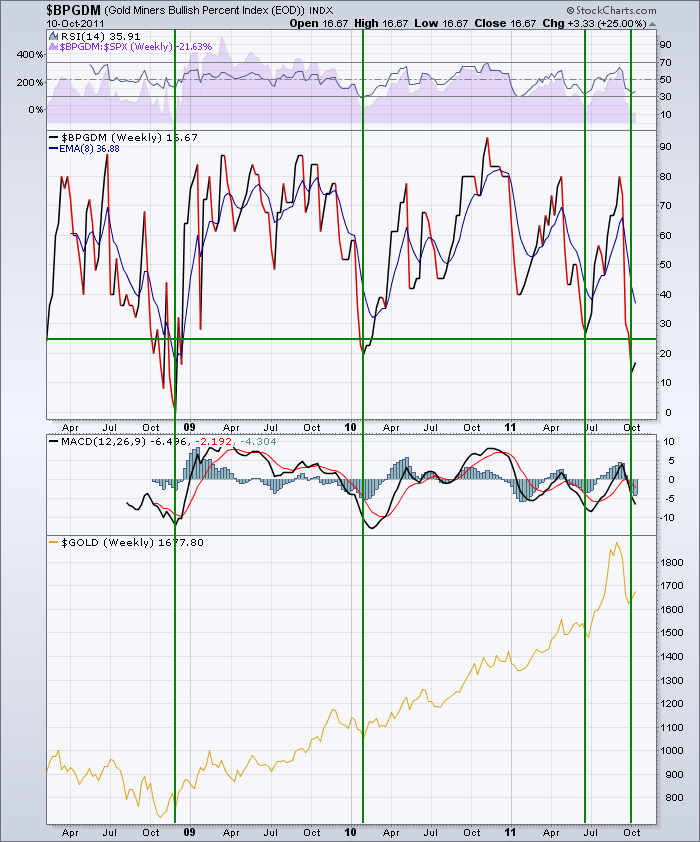
Yesterday, I mentioned a $BPGDM was at 15%. So what is that? That is the Bullish percent chart for the gold miners index.
Here's the chart.
If you are in The Canadian Technician blog site, you can click on subscribe to get this message posted to your inbox, or use the RSS feed. You can also find it on stockcharts.com Facebook page.
Good Trading,
Greg Schnell, CMT


