Well, On Friday all of my bullish sentiment indicators were solid green.
Today, the US market is rallying with gusto, albeit lower volume as it is a Thanksgiving Holiday in Canada and the Canadian market is closed.
Lets, check where the BCC models are at.
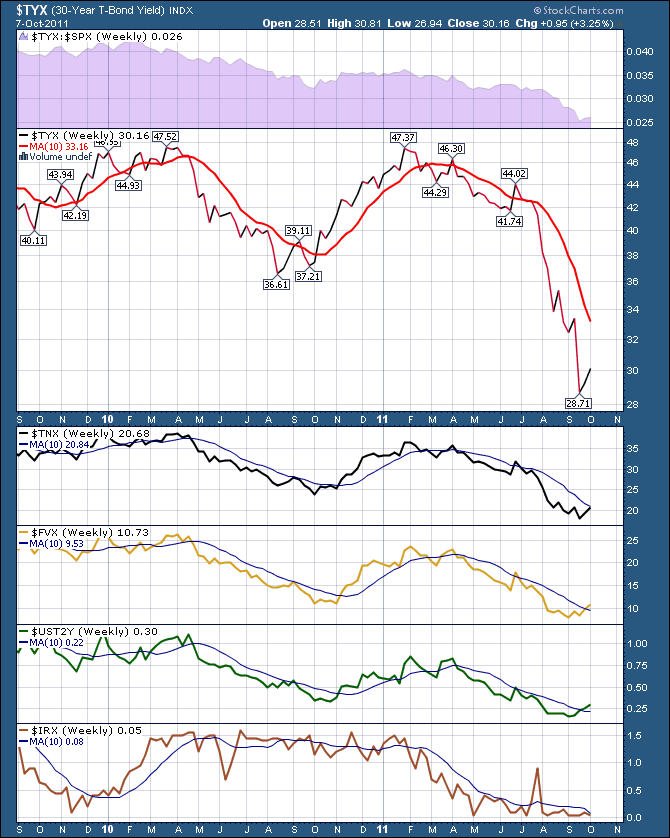
BONDS

So in order, the 30 year yield, 10 year yield, 5 year yield, 2 year yield, 3 month yield.
Notice that the shorter term charts are starting to turn up and are breaking above the 10 week line.
That is bearish for bond prices, bullish for bond yields.
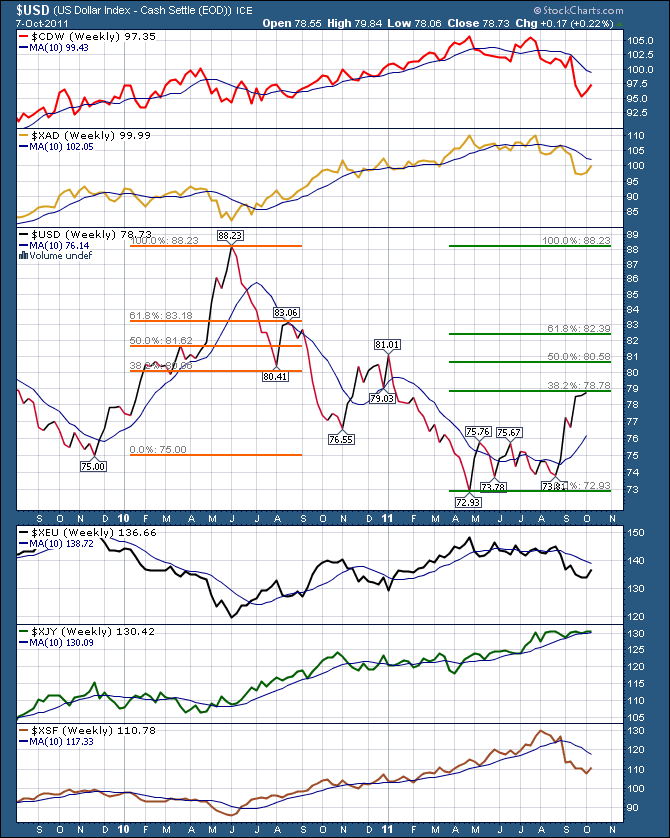
Currencies
Here is the currency dashboard. The slope on the 10 week line is pretty important. You can see the $USD has just bounced up to the first Fibonacci retracement level. Not surprising to take a breather here after a breathless run higher.
Everything except the Yen has moved a long way from the 10 week MA, so a little reset seems reasonable on the other currencies.
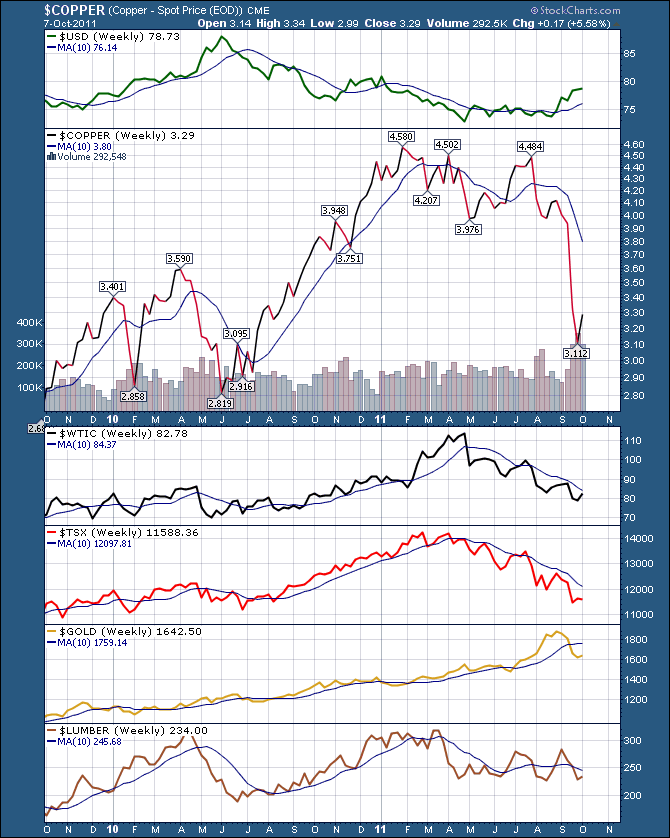
Commodities
Commodities are not moving in unison, but once again the 10 week slope seems to be a good provider.
The $USD has pushed the slope down or flat on every commodity. As most Canadians know, where the price of $WTIC is, so goes the $TSX. I put them next to each other on this chart. Crude is not that far away from it's 10 week and did pop above today.The Canadian oil stocks are currently the worst performing sector other than Solar on Investor's Business Daily. Some would say they can run a long way so this is a good time to enter. If you prefer to play leaders, this won't be your trade.
$WTIC may only be a rally back to the center of the Bollinger bands (20 Week MA).
Lots of companies with 50% earnings growth even with oil at $80. In a recent interview of one Calgary based company, they were absolutely on full throttle with 6 megaprojects underway or ramping up.
We noted on our review of Black Gold last week that the $74 area was important as it was a 50% retracement from the 2009 lows. $WTIC got support at $75 and has moved up quickly from there. $90 was the 2011 starting price, and it is also the centre of the Bollinger bands. $95 is the 40 week ma if we are looking for upside targets. Oil is trading above $85 today which is above the 10 week ma.
If it is a new bull market, great! If not, pay attention to price action at or near the targets.
Gold only has 15% on the $BPGDM. Historically that is a wonderful place to go long gold miners. Just an FYI on that one.
The lumber stocks have absolutely dismal earnings and the price action in lumber is sideways. It has not been downward like the oil and copper, so maybe some firming is in order?
Copper has fallen out of bed, hit it's head on the floor, and is trying to find where up is! Should be a solid bounce to the 38.2% fib or the 50% fib.
If you are in The Canadian Technician blog site, you can click on subscribe to get this message posted to your inbox, or use the RSS feed. You can also find it on stockcharts.com Facebook page.
Blogs only work if they are helpful. Let me know if this is.
Good Trading,
Greg Schnell, CMT


