What is it?
The 30 year Bond Yield is it. The bond yield has been trying to base (or at least I think it has).
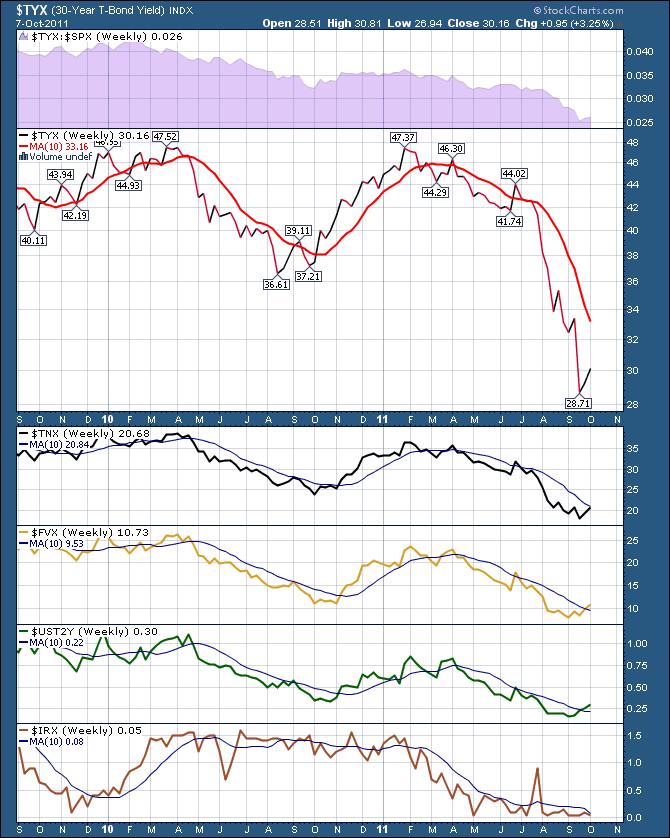
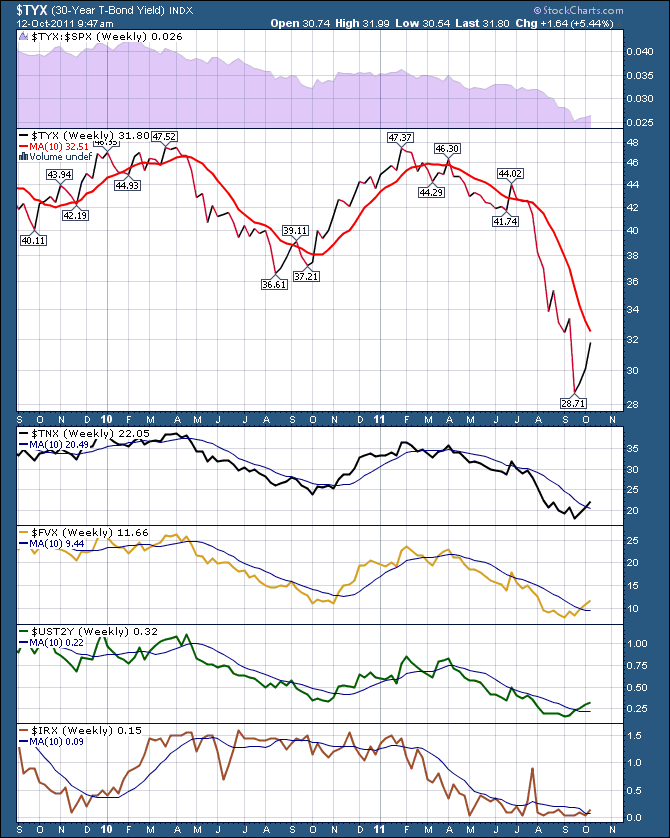
Look at the difference in these two charts. Notice the dates of the picture, top left on the charts.
This was a week ago.
Now take a look at the current, updated chart.
4 out of 5 have broken above the 10 week.
How to invest in this?
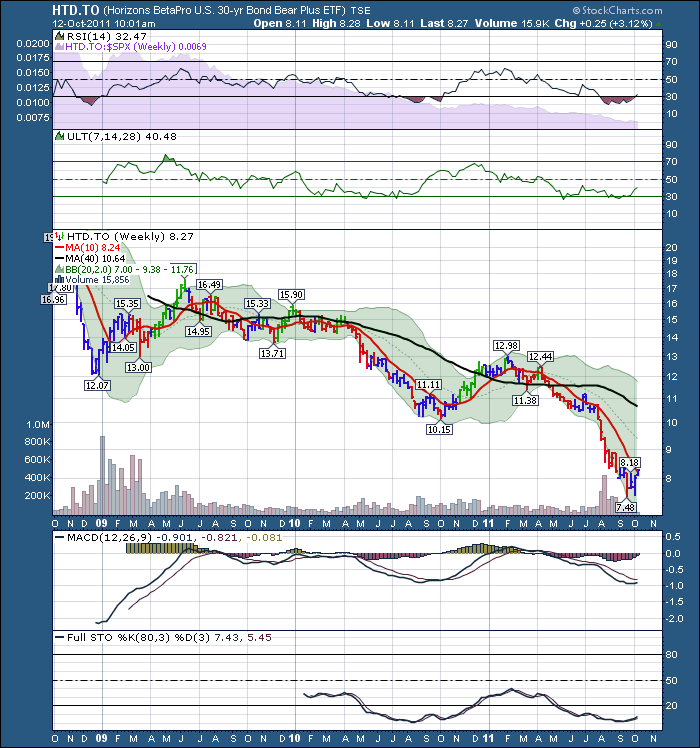
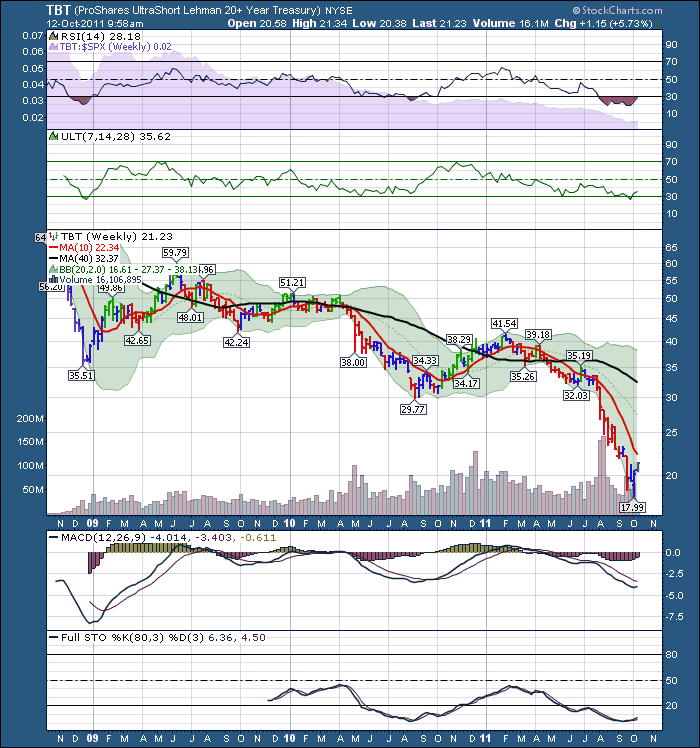
One method would be: HTD.TO or TBT in the US Market. Volume on the Canadian side is very low.
Here is the US Version.
Click on the pictures for a current chart you can work with that is also larger. If you are in The Canadian Technician blog site, you can click on subscribe to get this message posted to your inbox, or use the RSS feed. You can also find it on stockcharts.com Facebook page.
Good Trading,
Greg Schnell CMT


