Market Recap for Tuesday, February 19, 2019
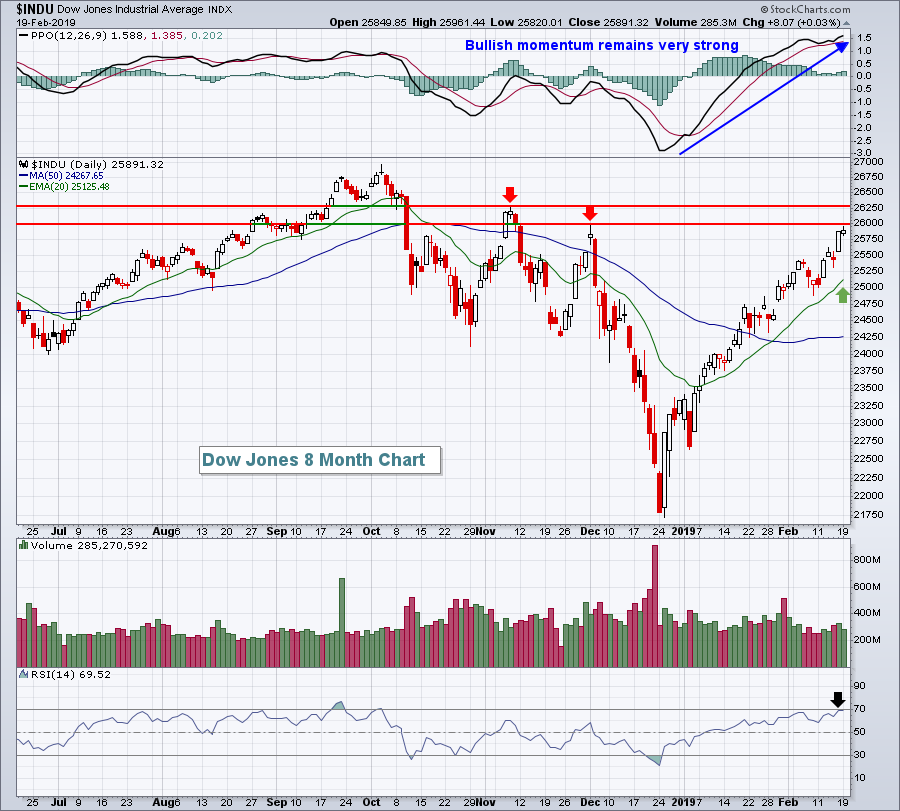
Materials (XLB, +0.62%) and utilities (XLU, +0.59%) led another Wall Street rally on Tuesday, although our major indices did see a bit of selling into the close. The XLB and XLU benefited from a falling dollar ($USD, -0.40%) and 10 year treasury yield ($TNX, down 2 basis points to 2.65%), respectively. On the consumer front, Walmart, Inc (WMT, +2.21%) delivered a solid quarterly earnings report to help lead consumer stocks higher. Both consumer staples (XLP, +0.52%) and consumer discretionary (XLY, +0.41%) outperformed our major indices as they all clung to fractional gains as the closing bell rang. The Dow Jones finished with just an 8 point gain after losing 70 points in the final hour. In addition to facing historical head winds this time of the month (see Historical Tendencies section below), the Dow Jones is now testing very important overhead price resistance:
 There's good news and bad news on this chart. Clearly, we've been in a massive uptrend off the December bottom and the strong PPO reflects that. But the Dow Jones is now testing overhead price resistance that was established during the two key Q4 rally attempts (red arrows). And we're testing that resistance with the RSI hitting 70 for the first time since the top in early October. Major price resistance and overbought conditions would suggest at least a pause and consolidation here. We haven't seen a 20 day EMA test since we cleared that moving average in the second week of January. A short-term drop and upcoming test honestly wouldn't be a bad thing for equities.
Healthcare (XLV, -0.24%) and industrials (XLI, -0.04%) failed to advance and lagged the other 9 sectors on Tuesday.
Pre-Market Action
Bonds, gold and crude oil are all relatively flat this morning, as are U.S. stock futures. Asian markets closed mostly higher overnight and European markets are performing well this morning as well. That enthusiasm has not carried over into U.S. stocks this morning, however, as Dow Jones futures are currently lower by 16 points with 30 minutes left to today's opening bell.
Current Outlook
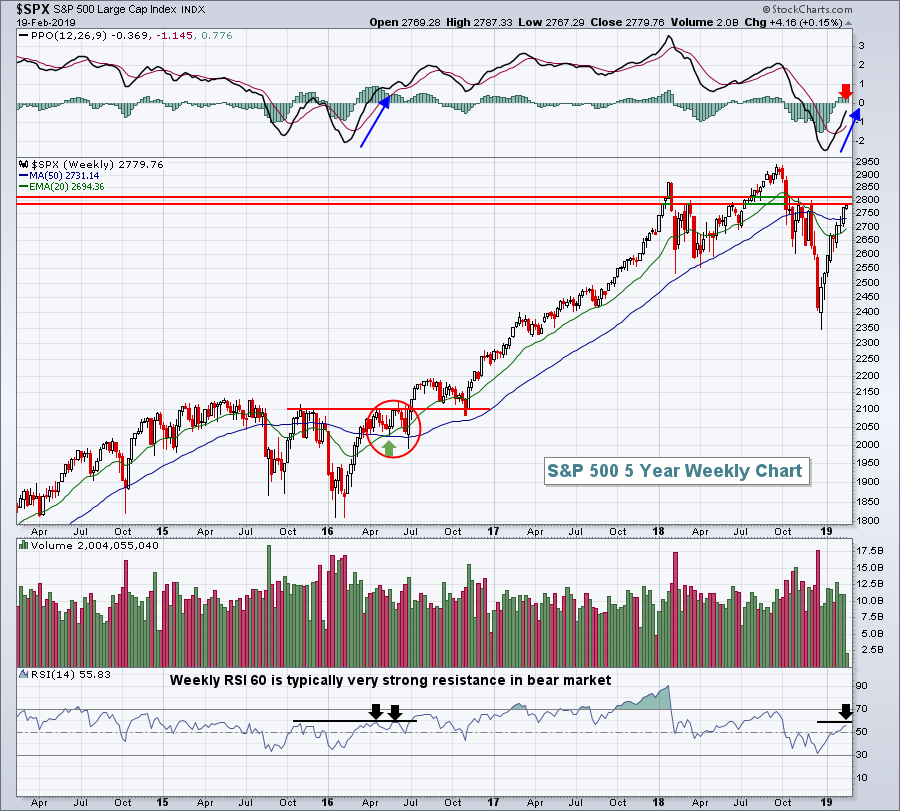
One characteristic of a bear market is that weekly PPOs do not move through centerline resistance. While countertrend rallies are normal, bullish momentum doesn't last long enough for weekly PPOs to turn positive. It never happened during the 2000-2002 bear market and it never happened during the 2007-2009 bear market. Currently, the weekly PPO is nearing its centerline resistance, as reflected below on the S&P 500 chart:
 This is it. If the bears hope to regain control of market action, now is the time. The above chart is the most bearish case I can make for the S&P 500 right now. In each of the past two bear markets, the weekly PPO never turned positive and the weekly RSI never moved above 60.
The red circle above shows congestion in 2016 as this same type of market configuration developed. I expect we could see the same kind of consolidation with false upside breakouts and false downside breakdowns. The stock market is never easy, so consolidation at the current level would likely confuse the most market participants. Based on that alone, this is our probable short-term path.
Sector/Industry Watch
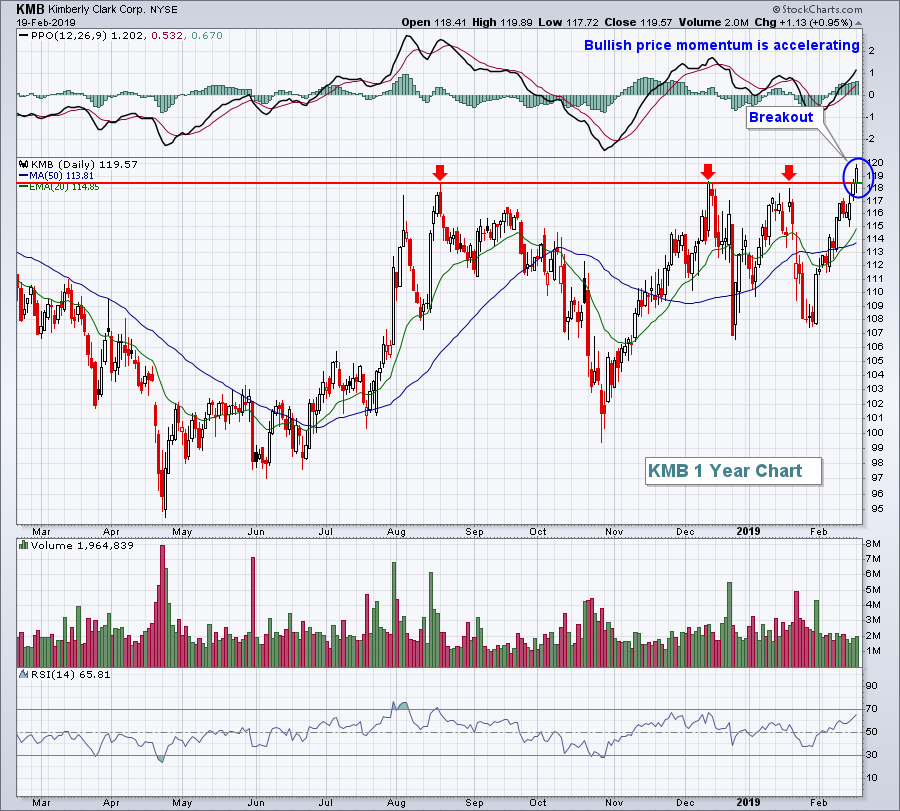
Nondurable household products ($DJUSHN, +1.34%) has broken out to new highs and one key component has been Kimberly Clark Corp (KMB, +0.95%). KMB looks very solid on its chart and could be a solid long trade at a time when the overall market is testing key overhead resistance. Should the market pull back, I'd look for KMB to be a solid outperformer, possibly even move higher during a period of equity weakness. Volume could have been better yesterday, but the triple top breakout is worth noting:
 The red arrows mark the triple top and Tuesday's close cleared them. Volume was only 2 million shares, however, so that's a bit of a concern. Let's see if volume picks up to confirm the breakout over the next few days.
Special Note
I joined John Hopkins, President of EarningsBeats.com last night for a fun and educational "Top 10 Picks" webinar where I discussed my Strong Earnings ChartList that I use to exclusively trade from. EarningsBeats.com provided an amazing 90 day offer for you to receive this Strong Earnings ChartList. If you have any interest in a copy of this ChartList, CLICK HERE to join EarningsBeats.com and for more details on their offer. You can also receive a copy of last night's recording where I disclosed my favorite 10 stocks from this ChartList over the last 90 days. The list I provided on November 19th averaged gaining 25% through February 19th while the S&P 500 rose a bit more than 3%. I know I'm biased because I helped develop the ChartList and trading strategy, but I think you'll find it's well worth the trial price.
Historical Tendencies
The following represents the annualized returns for each calendar day of all months on the S&P 500 since 1950:
19th: -34.69%
20th: -7.10%
21st: +4.91%
22nd: -12.04%
23rd: -2.40%
24th: -3.65%
25th: -6.84%
Consider that the S&P 500 has averaged gaining 9% per year over the past 7 decades. If every stock market day was created equal, we'd see +9% for each of the above calendar days, but instead every single one falls short of that 9% "average". This certainly provides us no guarantees that we'll see lower prices later this week, but history tells us to lower our trading expectations on the long side this week each month.
Key Earnings Reports
(actual vs. estimate):
ADI: 1.33 vs 1.28
CVS: 2.14 vs 2.07
ETR: .60 vs .48
FMS: .64 - estimate, awaiting results
GRMN: 1.02 vs .79
HFC: 2.25 vs 1.99
HSIC: 1.12 vs 1.11
LAMR: 1.48 vs 1.41
NI: .38 vs .37
OC: 1.38 vs 1.29
SO: .25 vs .24
WIX: .42 vs .31
(reports after close, estimate provided):
A: .73
ALB: 1.46
CPRT: .51
ES: .75
ET: .30
EXR: 1.20
FTI: .37
GDDY: .13
NTES: 2.69
O: .75
SNPS: .97
TS: .43
Key Economic Reports
None
Happy trading!
Tom
