Market Recap for Tuesday, February 19, 2019
We saw a bit of intraday back and forth action on Wednesday with the same result - another Wall Street gain. I'm really surprised we haven't seen more selling this week. We're at major price resistance levels on our major indices, there was incredible strength into options expiration Friday (usually a recipe for disaster the following week), 60 minute negative divergences are in play, and the bond market still isn't buying the idea of a stronger or strengthening economy ahead. Yet here I am again, discussing the strength that occurred the prior day. Welcome to Groundhog Day!
All of our major indices finished higher, led by outperformance by small caps. They've been showing consistent relative strength off the December bottom, a solid signal for the U.S. economy:
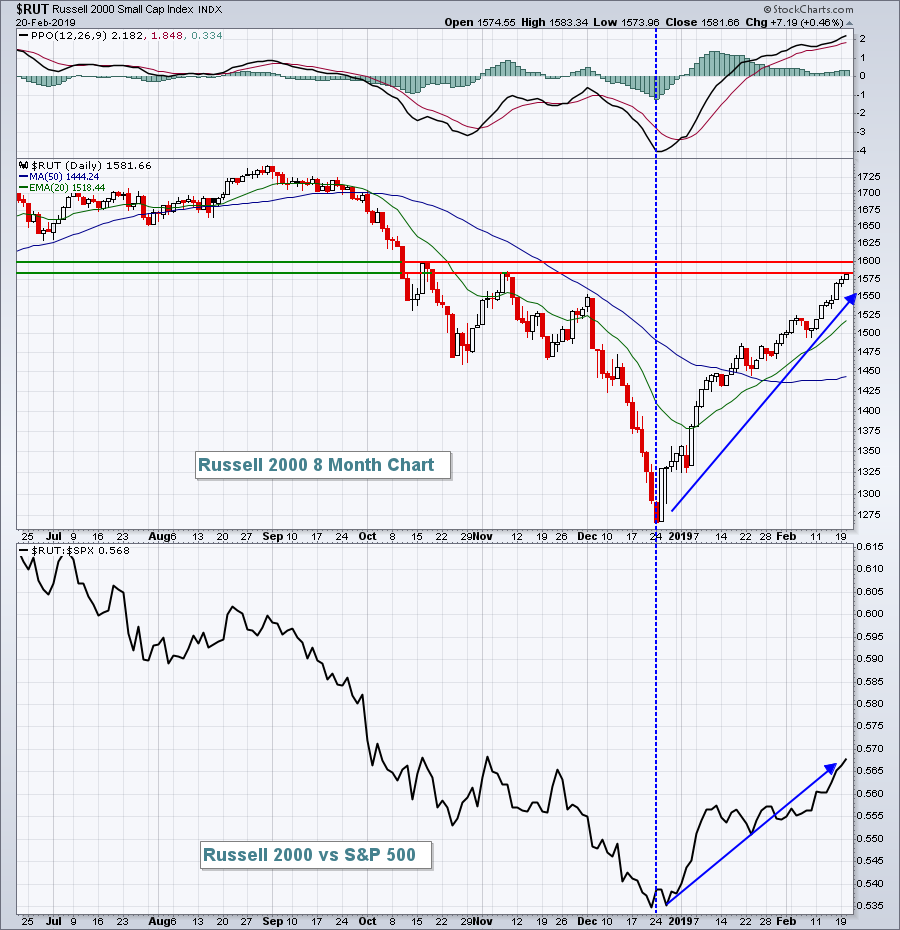 Small caps should have the tendency to perform better on a relative basis when stock market participants believe the opportunities are greater in small caps due to a more robust U.S. economy. Railroads ($DJUSRR) would give us the same type of signal and here's how they've been performing off the December low:
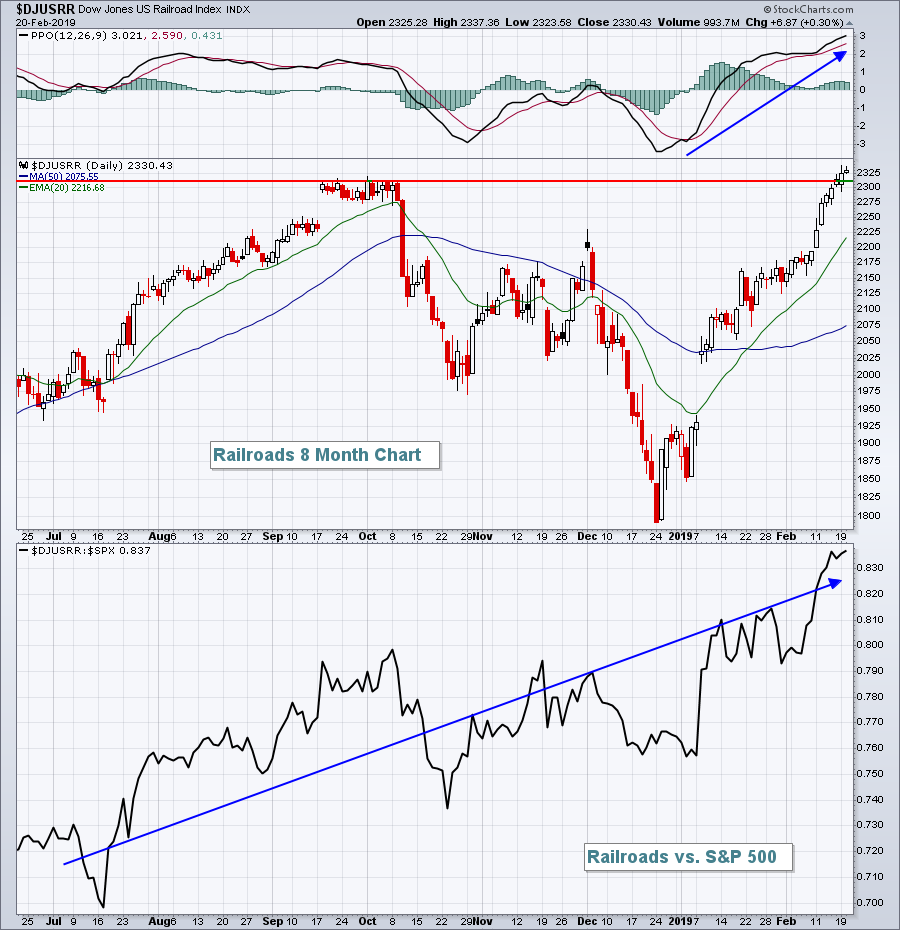 The DJUSRR has broken out and their relative strength is quite obvious.
I'm having trouble arguing with the strength in U.S. equities.
Pre-Market Action
The 10 year treasury yield ($TNX) is up 3 basis points this morning to 2.68%. We'll want to keep a close eye on the TNX. A rising yield would suggest rotation from bonds to equities and could potentially result in further gains in U.S. equities.
Dow Jones futures are slightly lower this morning, however, down 29 points with 30 minutes left to the opening bell.
Current Outlook
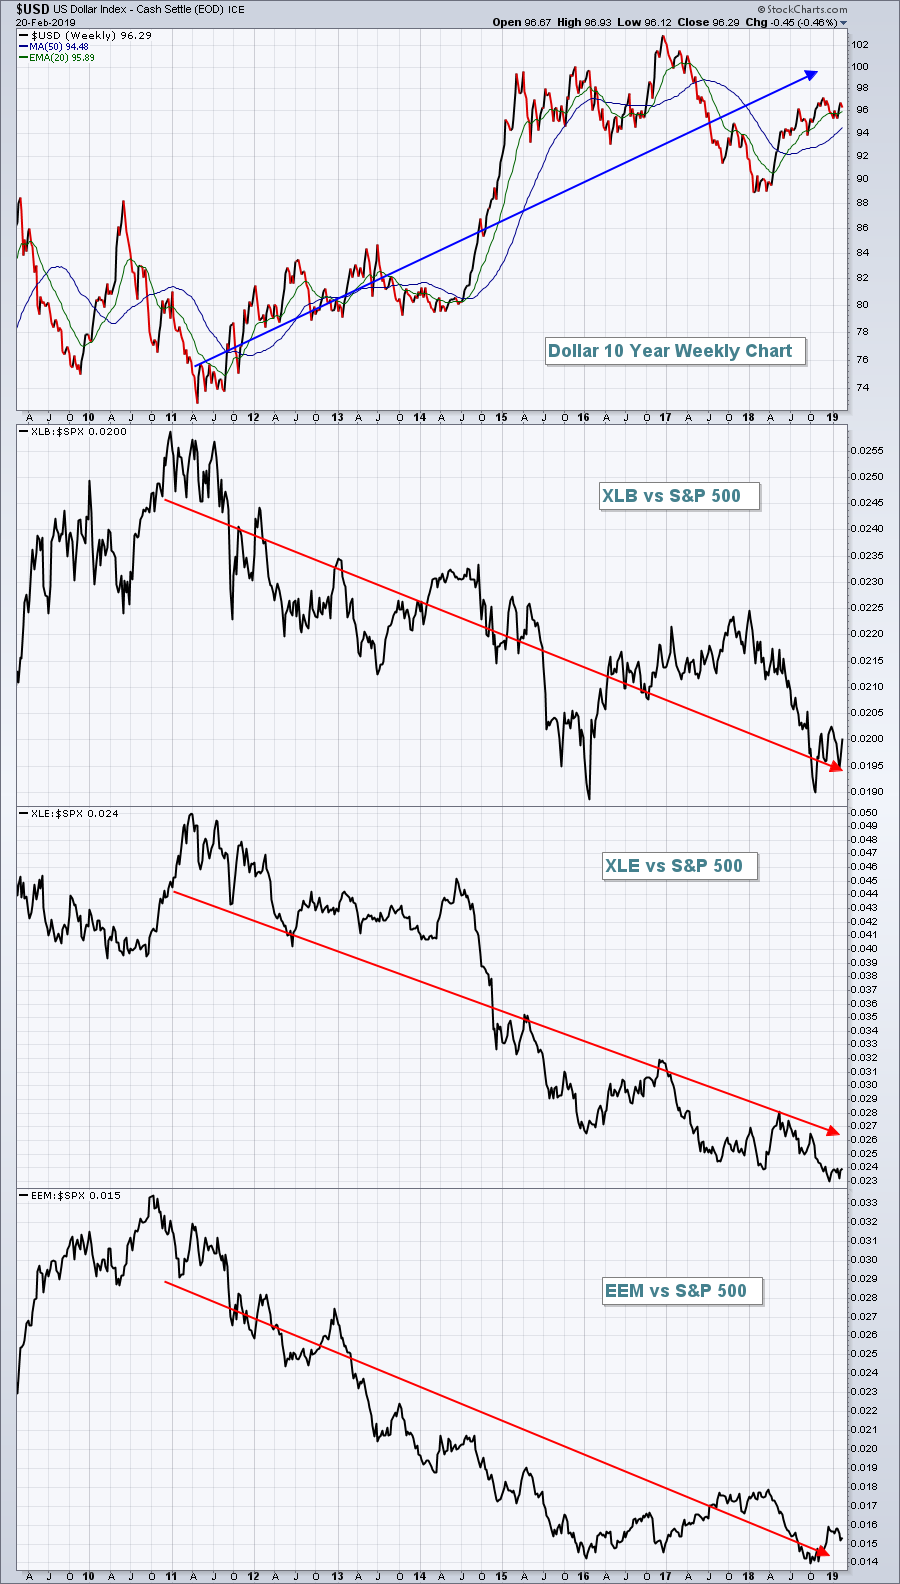
I continue to believe that we'll see a rising dollar throughout the balance of 2019....and beyond. If I'm right, underperformance vs. the benchmark S&P 500 by materials (XLB), energy (XLE), emerging markets (EEM) and many foreign ETFs (vs. the indices they track) should be expected to continue. Each of these has lagged since 2011, the same time the U.S. Dollar Index ($USD) bottomed. One of the most important signals to watch is the relationship between the U.S. 10 Year Treasury Yield ($UST10Y) and the German 10 Year Treasury Yield ($DET10Y). If the difference between these yields is rising ($UST10Y-$DET10Y), it's generally a pretty solid signal that the U.S. economy is likely to be stronger than the German economy - thus, the higher and more rapidly rising yield. Check out the following chart:
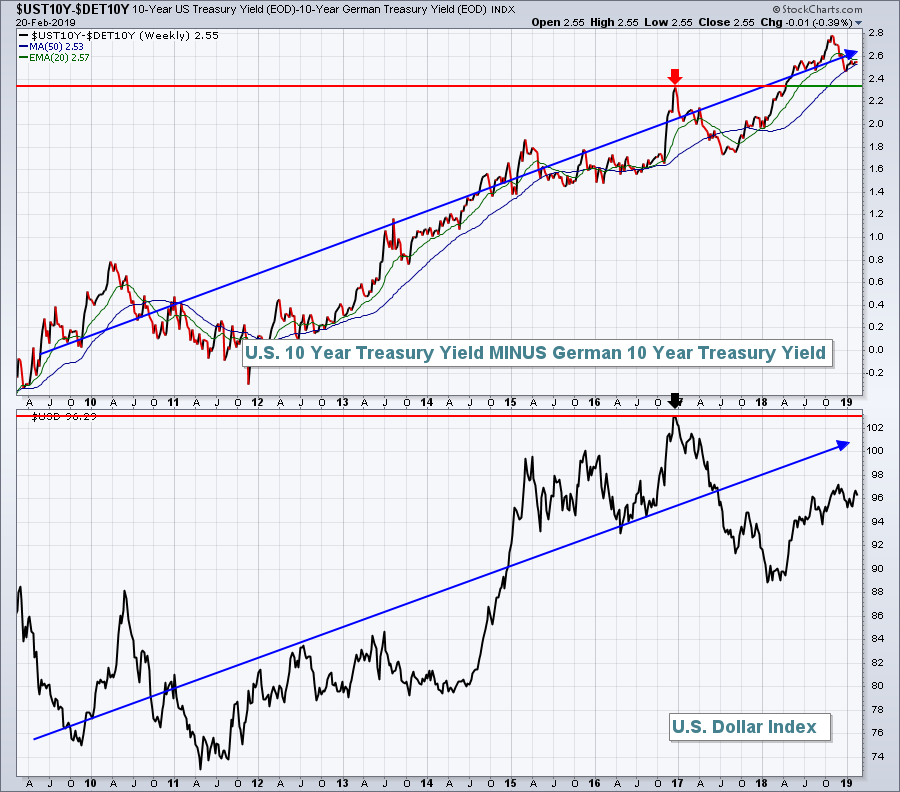 While you can see it's not a perfect positive correlation, I believe the strong relationship is quite clear. Not only that, but it makes sense. What drives a currency higher more than the strength of an economy?
In a rising dollar environment, the XLB, XLE, and EEM should be expected to lag on a relative basis. During our previous bull market from 2002 into 2007, the dollar was falling. Care to guess what led?
First, let's look at what happened during the bull market that began in 2009:
 See if you notice a difference when we look at the prior bull market:
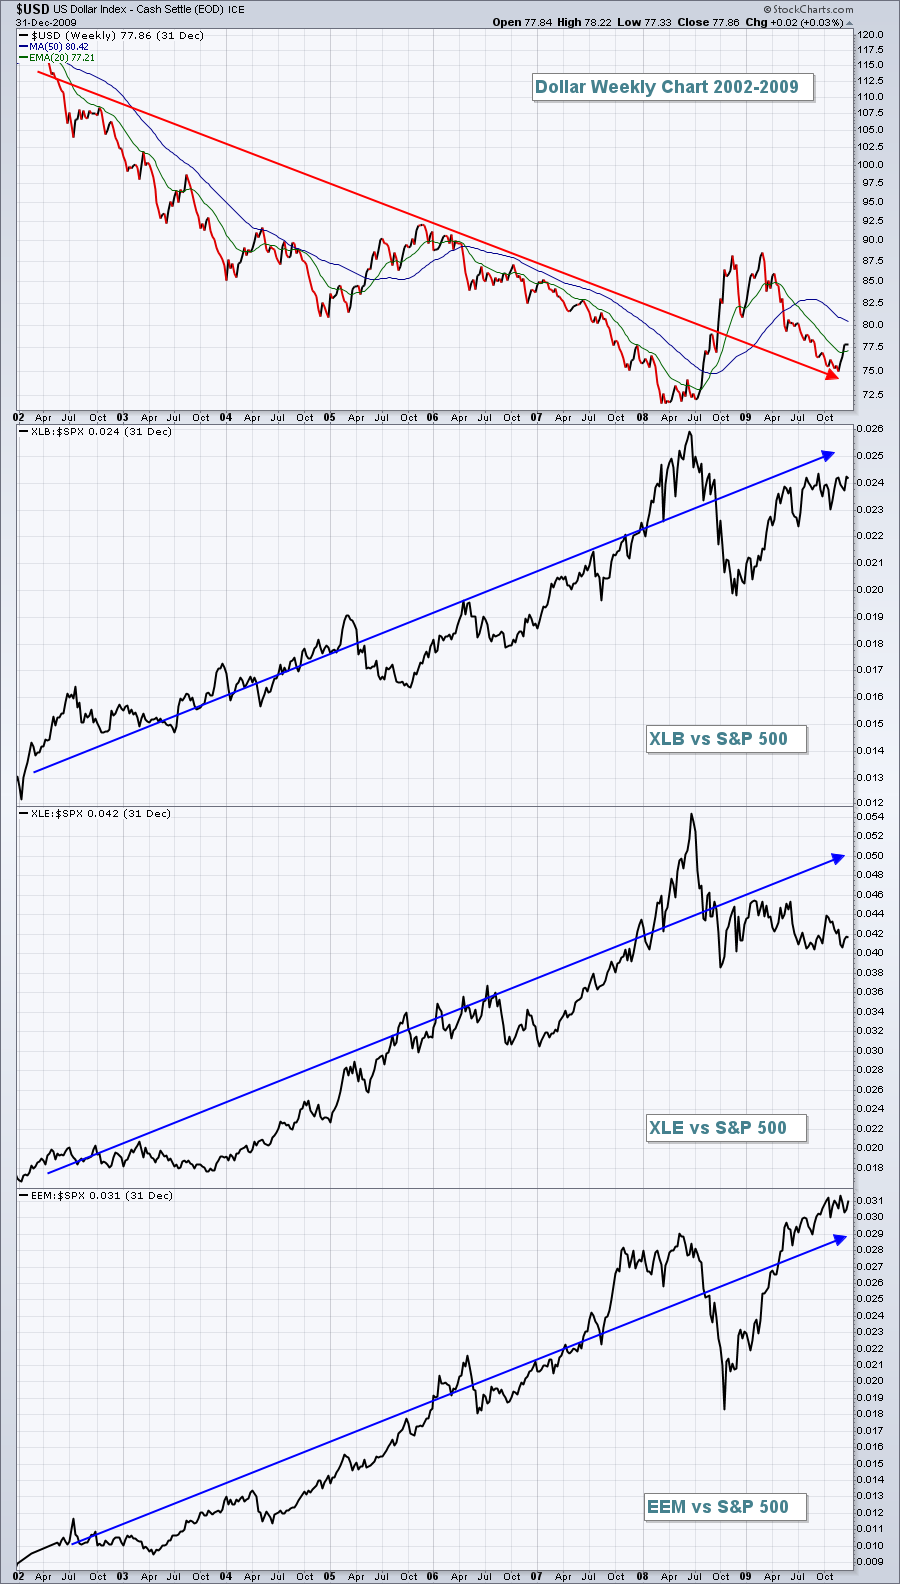 The direction of the U.S. Dollar really matters! It's why I continue to be very cautious on areas like gold ($GOLD). The short-term trend in gold has been great and it seems to have turned a corner, right? Well, I'd argue that it's already begun to roll over again on a relative basis:
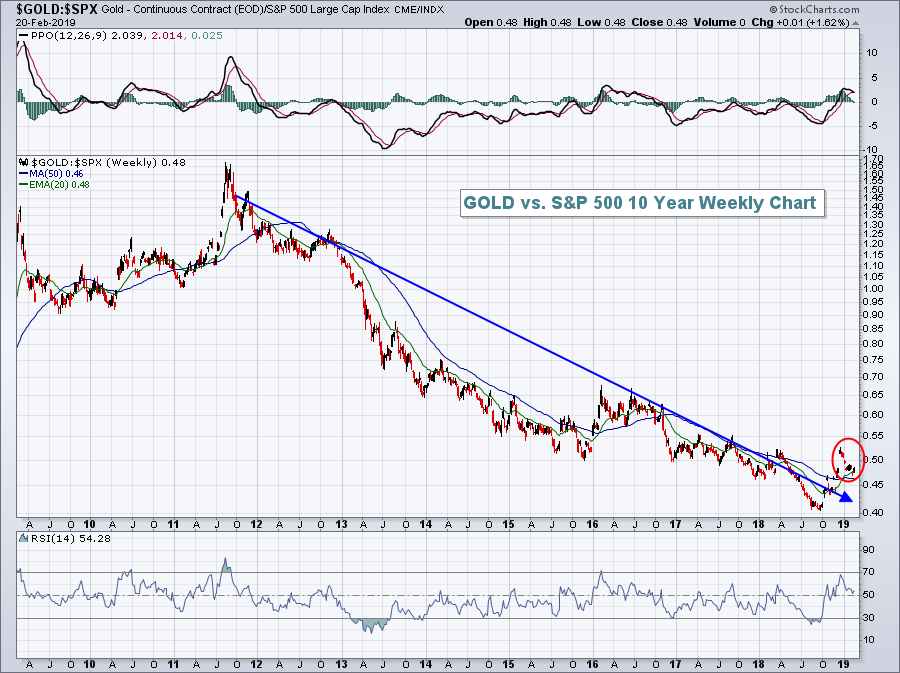 Those looking at GOLD's absolute chart will point to the recent uptrend, but how strong strong has GOLD been really? The red circle above shows that the long-term relative downtrend in GOLD appears to be regaining its downward momentum.
Until the dollar breaks its uptrend, I'd stay away from materials, energy and emerging markets. They're killing your performance.
Sector/Industry Watch
The U.S. Dollar Index ($USD) topped late last week and yesterday marked its fourth consecutive daily drop. One beneficiary of a falling dollar is materials (XLB) and that sector has taken advantage of the recent dollar weakness:
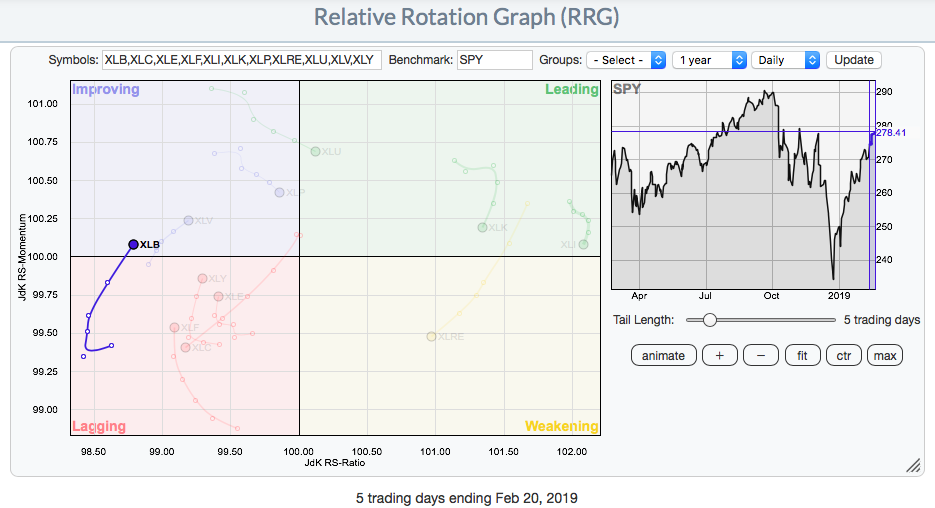 This shows all sectors relative performance to the benchmark S&P 500. Four days ago, with the USD at a near-term high, you can see that the XLB was diving deeper into the lagging sector, but the group has come to life with the corresponding dollar weakness. The USD's selling has taken it back to test its rising 20 day EMA. If the dollar holds that support level, the recent relative strength in the XLB could quickly end.
Historical Tendencies
The following represents the annualized returns for each calendar day of all months on the NASDAQ since 1971 (yesterday I provided these annualized returns for the S&P 500 since 1950):
19th: -33.20%
20th: -31.70%
21st: +14.58%
22nd: -1.01%
23rd: -4.12%
24th: +0.17%
25th: +5.81%
Based on the above, the 19th and 20th has clearly been the worst days of this week. Still, our major indices have been extended of late, so some selling the balance of this week is certainly a possibility.
Key Earnings Reports
(actual vs. estimate):
BCS: .17 - estimate, awaiting results
HRL: .44 vs .43
NEM: .40 vs .23
(reports after close, estimate provided):
ATUS: .14
BIDU: 1.69
BMRN: .10
DXCM: .16
ED: .76
EVRG: .24
HPE: .34
INTU: .86
IQ: (.69)
KEYS: .79
KHC: .93
PBA: .48
SBAC: 1.92
Key Economic Reports
Initial jobless claims released at 8:30am EST: 216,000 (actual) vs. 225,000 (estimate)
December durable goods released at 8:30am EST: +1.2% (actual) vs. +1.0% (estimate)
December durable goods ex-transports released at 8:30am EST: +0.1% (actual) vs. +0.2% (estimate)
February Philadelphia Fed survey released at 8:30am EST: -4.1 (actual) vs. 14.0 (estimate)
February PMI composite flash to be released at 9:45am EST: 54.1 (estimate)
January existing home sales to be released at 10:00am EST: 5,050,000 (estimate)
Happy trading!
Tom
