Market Recap for Thursday, February 21, 2019
U.S. stocks stalled on Thursday, but a minimum of sideways consolidation this week was to be expected given 60 minute negative divergences that I discussed earlier in the week. Before we talk about yesterday's action, check out how the negative divergence has played out rather well to the rising 50 hour SMA and note that the hourly PPO has nearly "reset" back to its centerline (pink arrows):
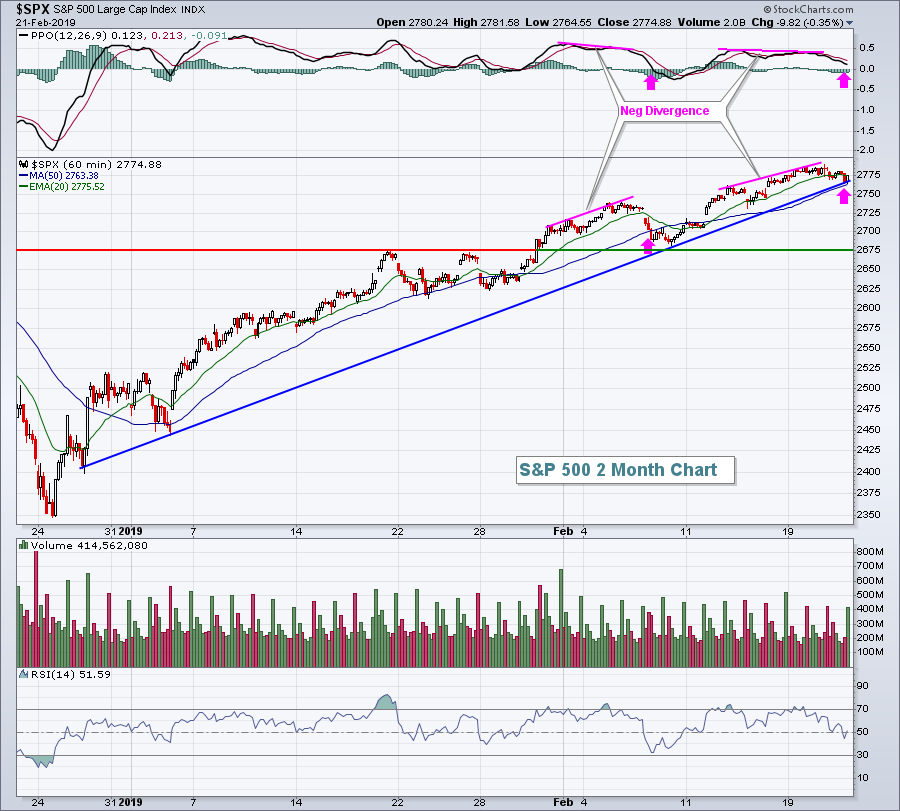 In addition to testing its 50 hour SMA, the SPX also pulled back almost exactly to trendline support. The slope of this trendline is meant to be broken at some point as the rally since this uptrend line formed has been 15% over just two months. That is clearly an unsustainable rate of growth every two months. But let's enjoy it while it lasts. I fully expect that once this trendline breaks, our march higher will be much slower, much more mundane, and quite possibly very boring as the Volatility Index ($VIX) continues to drop. If you're wondering why the stock market doesn't sell off for long before another ascent, it's because of the VIX being at 14 instead of 35. Fear is dissipating. When there's little fear, buyers re-emerge on every little bit of profit taking. It's how the market works. Therefore, until we see a breakdown in the S&P 500 (see Current Outlook section) and a surge in the VIX, it's very unlikely we'll see the type of impulsive selling that we saw in Q4 2018.
All of our major indices finished lower on Thursday, although there was late-day buying that cut into earlier losses. For instance, the Dow Jones fell 103 points on the session but it was down nearly 200 points with 30 minutes left in the session. That final rally nearly cut the Dow's loss in half.
Defensive groups led as utilities (XLU, +0.73%), consumer staples (XLP, +0.29%), and real estate (XLRE, +0.17%) were the top 3 performing sectors. Among all the other sectors, only technology (XLK, +0.04%) finished in positive territory as software ($DJUSSW, +1.12%) had a very strong day thanks to a short-term breakout in Microsoft (MSFT, +2.11%):
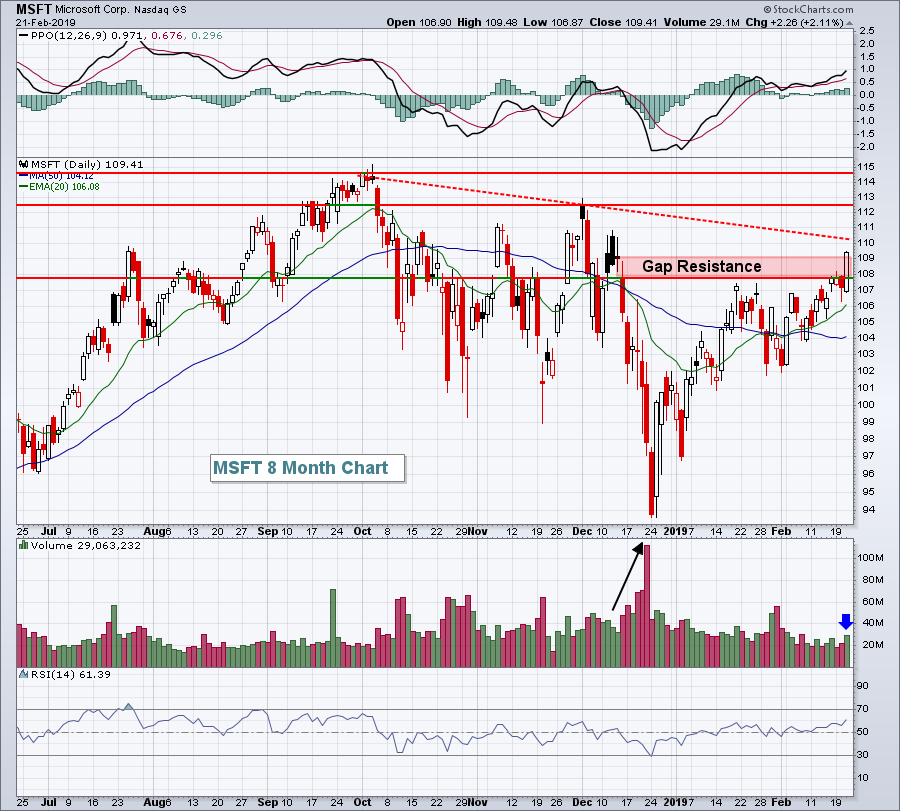 MSFT's volume increased as it broke above a key gap resistance zone from December. Volume accelerated back in December after the gap lower so getting back through this area is Step 1 to a healthier chart. While MSFT was the leading stock in the Dow Jones on Thursday, there's much more work to do here technically. Trendline resistance (red-dotted line) and overhead price resistance established from highs in October and December must all be negotiated and there are likely to be sellers waiting at each level, especially overhead price resistance. Given that software stocks have been so strong, however, I imagine it's only a matter of time before MSFT bulls win each battle.
Energy (XLE, -1.55%) and communication services (XLC, -0.93%) were market laggards yesterday. That latter sector was weighed down by recent weakness in internet shares ($DJUSNS, -1.37%). I like this group for a short-term bounce, however, as it tested its rising 20 day EMA with yesterday's selling.
Pre-Market Action
Crude oil ($WTIC) is up 1.25% this morning to $57.67 per barrel as the 10 year treasury yield ($TNX) drops yet again, this time 3 basis points to 2.66%.
Asian markets were mostly higher overnight, especially in China where the Shanghai Composite ($SSEC) rose nearly 2% on heightened optimism over a US-China trade deal. There's also strength in Europe as major indices there are up mostly in the 0.50% range.
Kraft-Heinz (KHC) is tumbling in pre-market action after poor results and big write-downs. At last check, KHC is down nearly 25%. Dow Jones futures remain in positive territory, up 90 points with 30 minutes left to the opening bell.
Current Outlook
U.S. stocks are performing extremely well again and I'm seeing more and more signs of another break to all-time highs. To the downside, I'm watching 20 week EMA support. I would turn more cautious if the S&P 500 has a weekly close back beneath that now-rising moving average, currently at 2693. Otherwise, waiting for a retest of the December low could be painful. In my opinion, we're in a secular bull market. If I'm right, we'll very likely see significant stock market gains over the next 3-5 years. Don't allow your emotions to dictate your investing/trading strategy. Again, if the charts break down, then yes it'll be time to re-evaluate.
I continue to favor the consumer discretionary sector (XLY). It's typically a leader during major stock market advances and the following chart highlights how important it is to overweight this sector when its relative PPO is above the zero line:
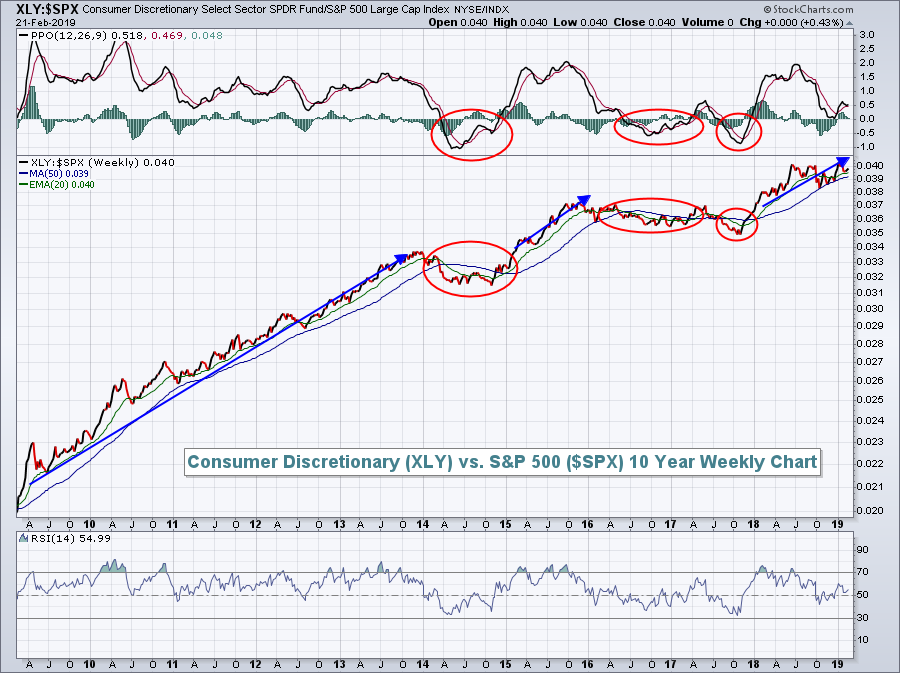 The PPO on the XLY:$SPX just recently touched centerline support with the relative strength in consumer discretionary improving once again. Should the S&P 500 break out to all-time highs again, I believe the XLY will be the leader. Your clue will be a new relative high, clearing the relative highs established over the past 6-8 months.
Sector/Industry Watch
Restaurants & Bars ($DJUSRU, +0.51%), a consumer discretionary group, had been a significant outperformer in the second half of 2018, but recently has taken a back seat to many other areas. I suspect we'll see a renewal of that 2018 relative strength if the DJUSRU can clear overhead price resistance:
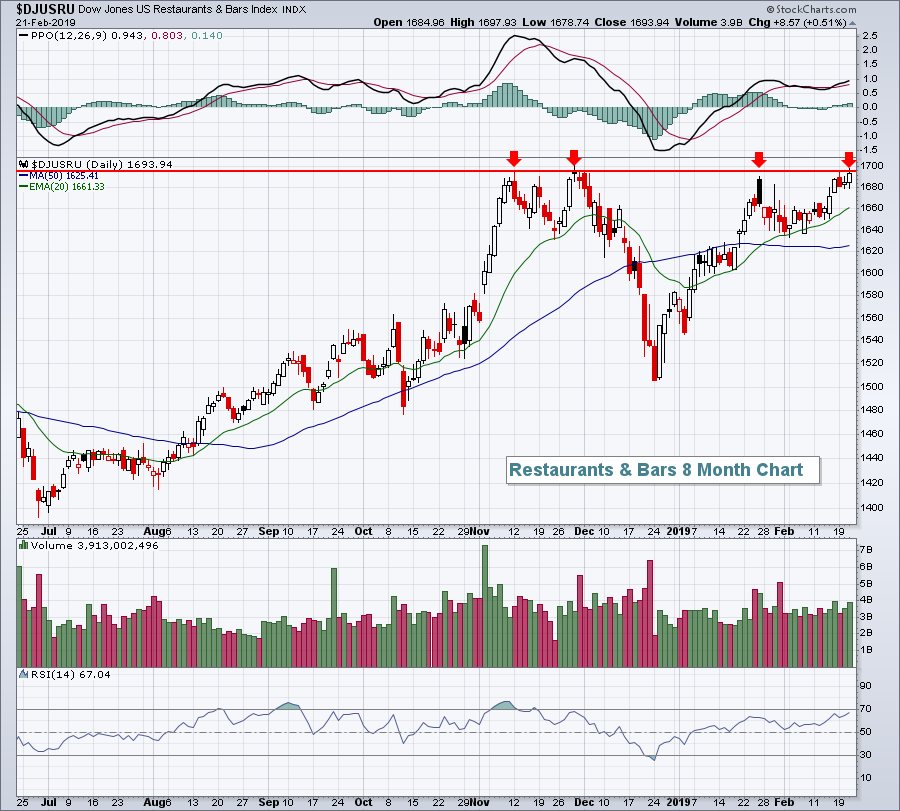 Volume has begun to increase the past few sessions so I expect to see the breakout sooner rather than later.
Historical Tendencies
Should we see that breakout in restaurants & bars, one stock in particular could benefit nicely. Chipotle Mexican Grill (CMG, +0.58%) recently reported excellent quarterly earnings, easily topping Wall Street estimates. In addition, January to May is CMG's seasonal sweet spot. Take a look at CMG's average returns for each of these five calendar months over the past 14 years:
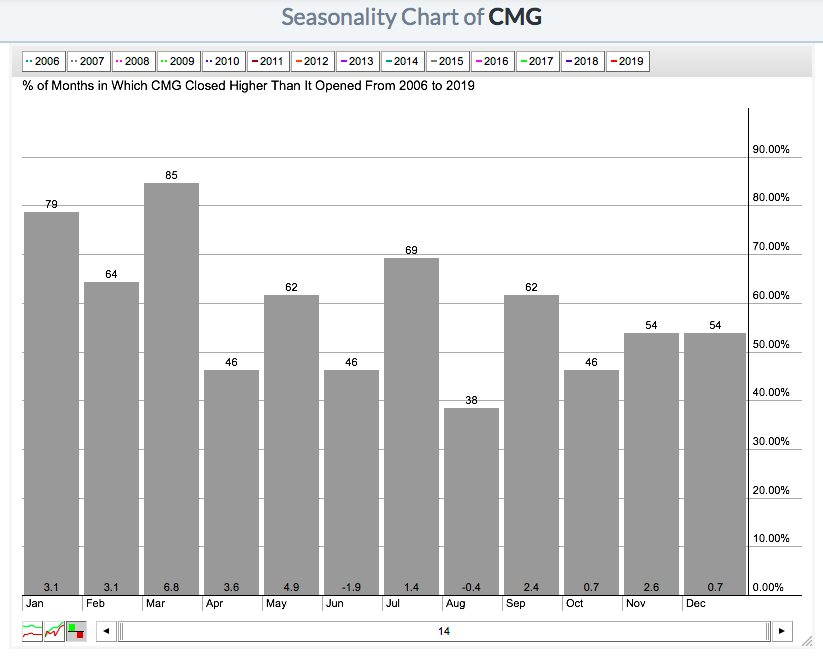 Add it up. The first 5 months have averaged gaining 21.5% over the past 14 years! The other 7 calendar months have averaged gaining just 5.5%. A lot seems to be coming together for CMG to make a nice Spring run higher.
Key Earnings Reports
(actual vs. estimate):
AN: 1.10 vs 1.14
COG: .55 vs .58
ITT: .82 vs .74
MGA: 1.63 vs 1.60
PNW: .17 - estimate, awaiting results
RY: 1.65 vs 1.66
W: (1.12) vs (1.30)
WPC: 1.33 vs 1.33
Key Economic Reports
None
Happy trading!
Tom
