Market Recap for Friday, February 15, 2019
Friday produced very solid gains as the U.S. government averted a second shutdown as a funding resolution was passed. Also, there was word that US-China trade talks were progressing and any positive developments there are typically well-received by global markets. In an odd twist, the largest companies and the smallest companies provided leadership as the Dow Jones and Russell 2000 showed the biggest gains at 1.74% and 1.56%, respectively. The S&P 500 and NASDAQ had nice days as well, gaining 1.09% and 0.61%, respectively.
One reason for the NASDAQ's underperformance was that leadership came from financials (XLF, +2.13%). Outside of financial administration stocks ($DJUSFA, +1.12%), the NASDAQ 100 ($NDX, +0.47%) has no financial stock representation. Financials were led higher by several groups, including full line insurers ($DJUSIF, +3.86%), banks ($DJUSBK, +2.41%), and life insurance ($DJUSIL, +2.35%). The former group's huge spike occurred after much selling on Thursday as the group remains in a potential bottoming reverse head & shoulders pattern:
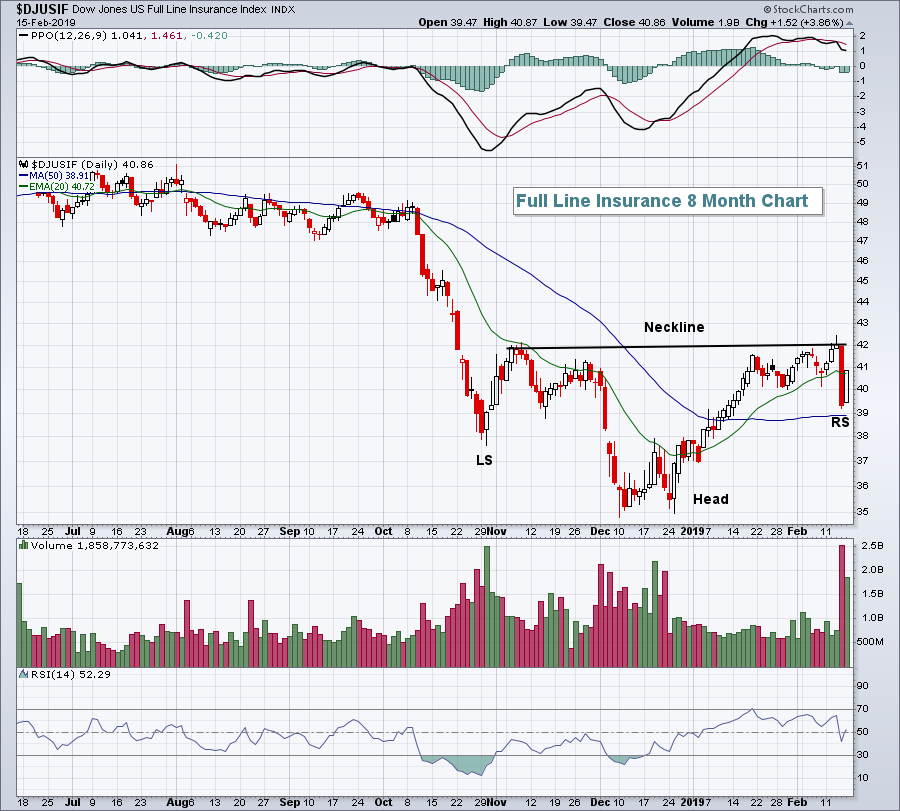 I like the up sloping neckline, suggesting that bullish momentum could be building. But we need the confirmation of a high volume close above neckline resistance near 42.
Life insurance is also showing more bullish signs, but faces short-term issues in the form of overhead price resistance and a negative divergence:
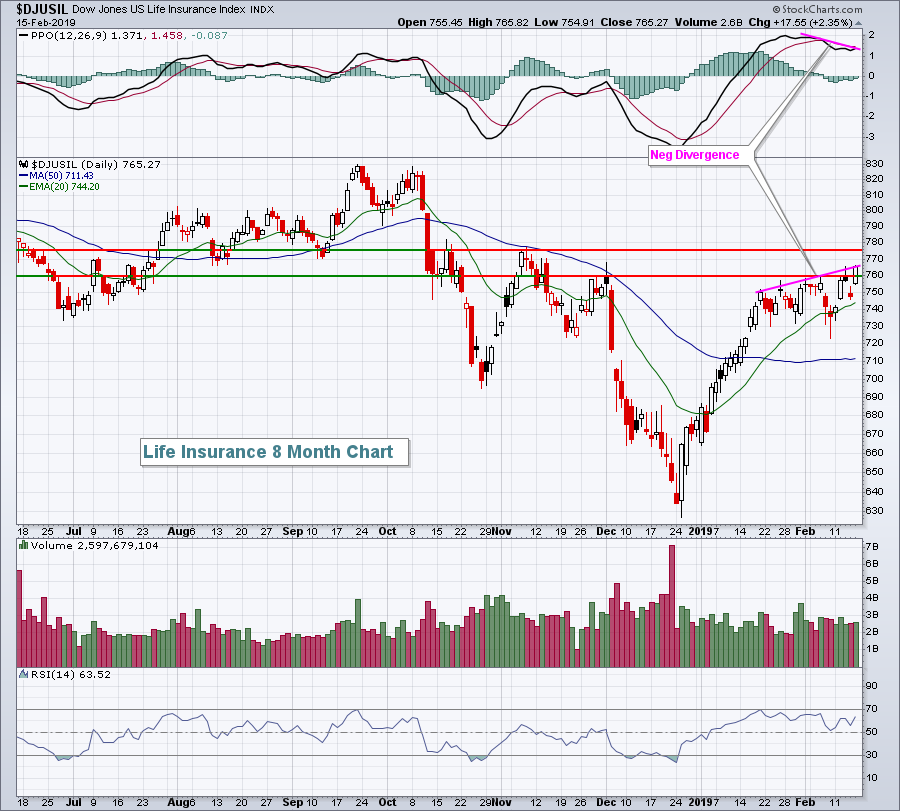 Negative divergences produce warnings as upside price momentum slows. While it never provides us a guarantee of future lower prices, I'd at least beware of its ominous signal. To feel better about the life insurance group, I'd want to see an increase in volume to corroborate a breakout above price resistance near 775 or renewed selling to successfully test recent price support closer to 730. The DJUSIL also has a strong long-term positive correlation with the direction of the 10 year treasury yield ($TNX). The languishing TNX is a short-term concern as well. A TNX that breaks out above 2.80% in time, however, would be an extremely bullish fundamental development for life insurance companies.
All 11 sectors were higher as we witnessed a broad-based advance on Friday. The defensive utilities (XLU, +0.31%) and real estate (XLRE, +0.60%) sectors were laggards.
Pre-Market Action
Asian markets were mixed overnight, while European markets are lower due to a weak banking group. The 10 year treasury yield ($TNX) continues to be an issue for equities as the TNX is down 2 basis points this morning to 2.65%.
Walmart (WMT) is up more than 3% this morning after reporting very strong quarterly results. Still, U.S. futures are weak, with Dow Jones futures pointing to a 60 point drop at the open with less than 30 minutes to the opening bell.
Current Outlook
This could be a rough week. I'm leery any time we see a nice rally into and during options expiration week. I've pointed out historical tendencies below, so be sure to check them out. The end of options expiration and the week after can be difficult after a move higher as there's plenty of motivation for market makers to become sellers. It's also worth noting that the S&P 500 printed a negative divergence on its hourly chart, a short-term negative:
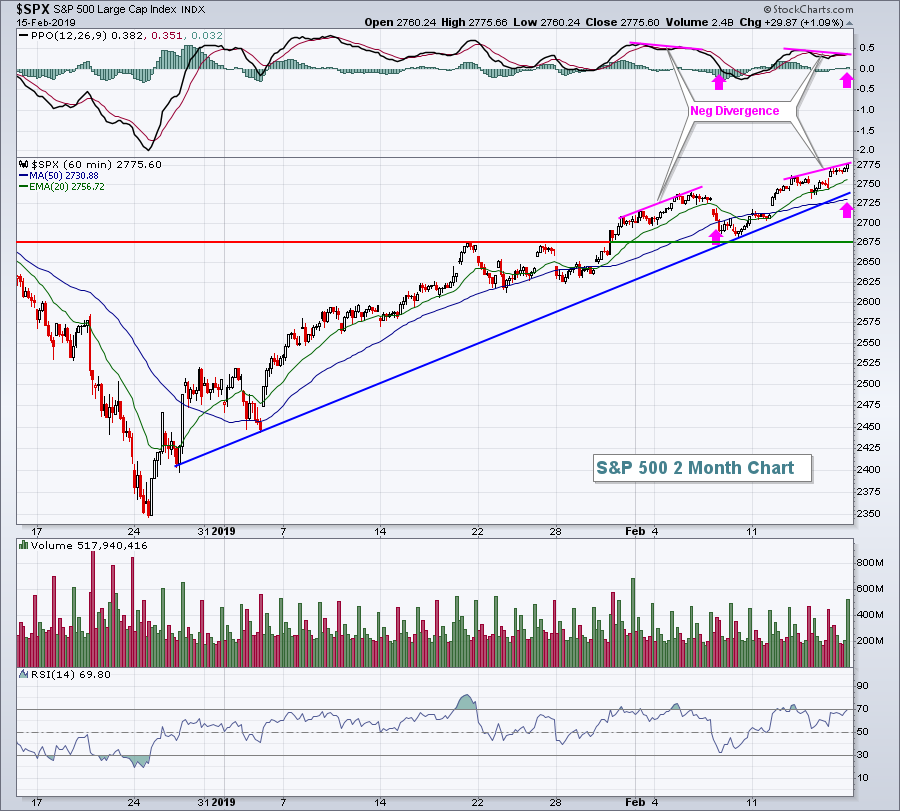 When negative divergences emerge, I look to rising 50 period SMAs for likely tests and possible PPO centerline "resets". The pink arrows highlight those developments in January and the potential here in February.
Bottom line: I wouldn't be at all surprised to see short-term selling and consolidation this week. A 1%-2% selloff would actually be very healthy and would help to relieve overbought conditions.
Sector/Industry Watch
The Mobile Telecommunications Index ($DJUSWC, +2.10%) had a solid day on Friday, closing back above its 20 day EMA for the first time in nearly a month. The industry has bounced off of excellent price support in the 340-350 area and now is poised to test its downtrend resistance line near 370. A break above that would be extremely bullish:
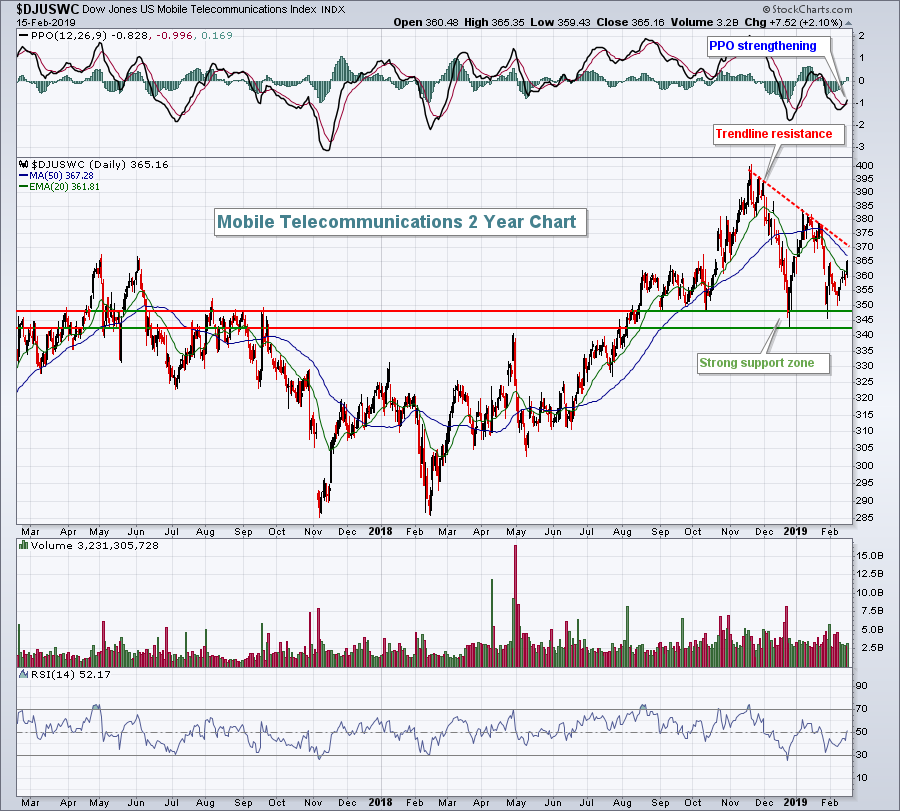 The DJUSWC has been a relative laggard in 2019, but the group now appears to be regaining some relative strength. A breakout above trendline resistance would likely add to its relative strength.
Monday Setups
For this week's setup, I'm going with T-Mobile US, Inc. (TMUS). After months of sideways consolidation, TMUS joined the party on Friday, clearing overhead resistance and doing so with increasing volume, a bullish combination. I would be looking for 80-82 as a price target, while the rising 20 day EMA could serve as a short-term closing support level:
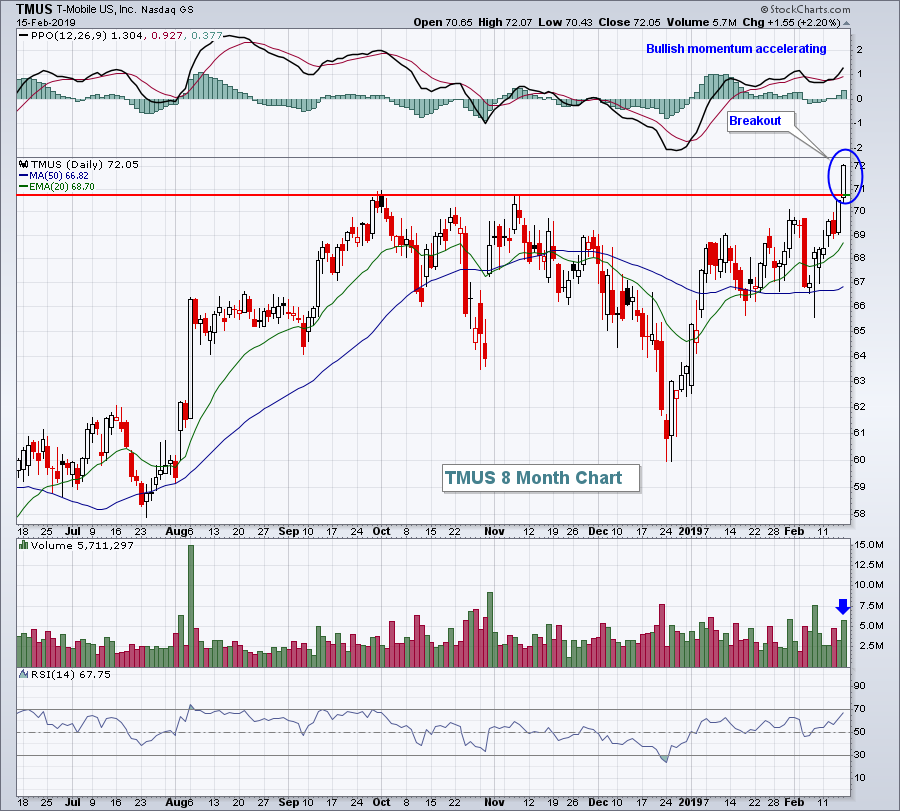 A stock that bases for a significant period before breaking out typically trends higher for quite awhile. I would expect for TMUS to perform very well on a relative basis over the next several weeks.
By the way, seasonally it doesn't get any better for TMUS. Check out the following seasonality chart:
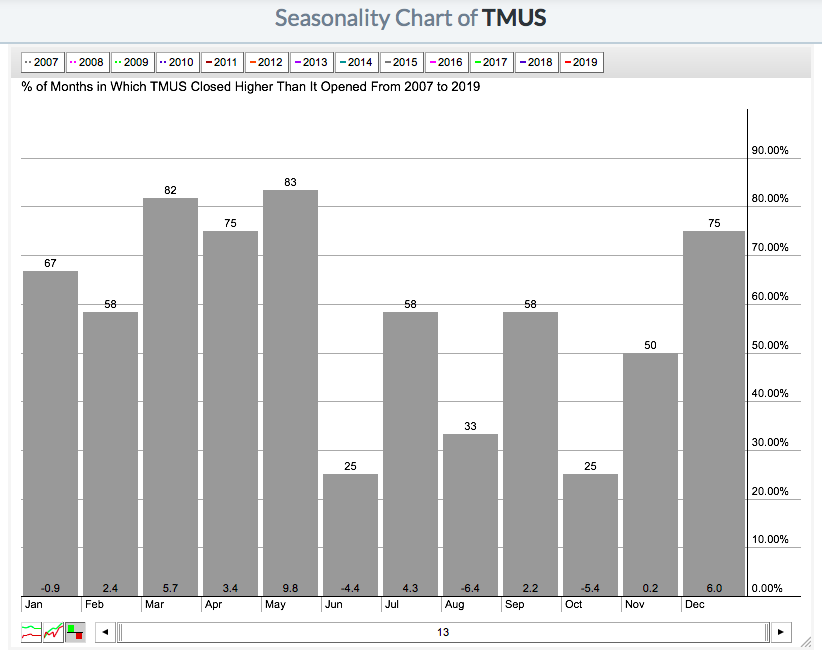 TMUS has absolutely loved February through May over the last 13 years, where it's averaged gaining 21.3%!!! At the top of the March, April and May columns, you can see the frequency with which TMUS gains ground during each of those three calendar months.
It's also noteworthy that TMUS recently beat Wall Street's consensus estimates. Its revenues were $11.45 billion (vs. $11.41 bil estimate) and its EPS came in at $.75, well ahead of the $.69 estimate.
Based on the technical breakout, earnings beat and seasonal trend, TMUS certainly appears to be a great reward to risk trading candidate. This is a great way to uncover superior trading candidates and I'm going to unveil my Top 10 Picks for the next 90 days from my Strong Earnings ChartList today at 4:30pm EST. If you'd like these picks and a copy of my Strong Earnings ChartList, EarningsBeats.com has agreed to offer up a ChartList service with a $7 trial for 90 days. They'll send you their Strong Earnings (and Weak Earnings) ChartList every time it changes for the next 90 days, a superb deal. CLICK HERE for the offer and then plan to join me for my Top 10 Picks webinar (included in the trial price) on Tuesday.
I did a similar Top 10 Picks on November 19, 2018 for the EarningsBeats.com community and those picks crushed the S&P 500. The average gain for my 10 picks was +17%, while the S&P 500 gained less than 1%. I'll see what I can do for an encore. :-)
Historical Tendencies
Well, it's the 19th of the month. For those that are unaware, the 19th calendar day of the month has been the worst calendar day since 1950 on the S&P 500. The annualized return is -34.69% and it falls during the worst week of the calendar month, the 19th through the 25th, which has produced annualized returns of -8.8% over the last 69 years. While you might say it's "just a week", it's one week in every month for nearly 7 decades. It represents close to 25% of all trading days over that time span. It's a big deal for in-the-know traders that lower their expectations on the long side during this time of the calendar month. Hedging strategies are not a bad idea, especially when the market is coming off the kind of recent gains like we just experienced in the first half of February.
Key Earnings Reports
(reports after close, estimate provided):
(actual vs. estimate):
AAP: 1.17 vs 1.14
EXPD: 1.02 vs .85
GPC: 1.35 vs 1.32
MDT: 1.29 vs 1.24
WMT: 1.41 vs 1.33
(reports after close, estimate provided):
AWK: .69
CDNS: .48
CXO: 1.10
FE: .48
VRSK: 1.06
Key Economic Reports
February housing market index to be released at 10:00am EST: 59 (estimate)
Happy trading!
Tom
