Market Recap for Thursday, October 4, 2018
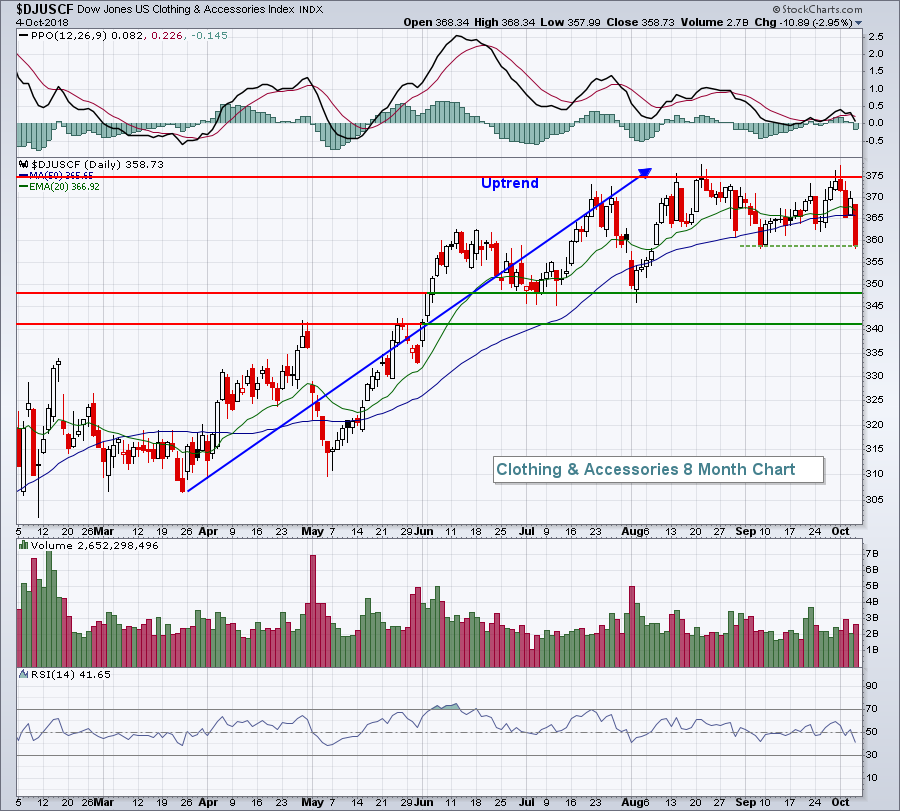
While we've seen plenty of market rotation over the past several months, there hasn't been much outright selling. Yesterday changed that. The NASDAQ recovered off of its intraday lows a bit to "only" close down 1.81% on the session. The NASDAQ was easily the worst performing index, but it had plenty of company. Hardest hit areas included many of the best performing industries of 2018. Specialty retailers ($DJUSRS) were among the poor performers and are featured in the Sector/Industry Watch section below. Clothing & accessories ($DJUSCF) represented the weakest consumer discretionary (XLY, -1.57%) industry group as their recent failure to breakout became costly:
 The DJUSCF closed on short-term price support (green dotted line) yesterday, but any further weakness looks like it could lead to deeper selling and perhaps a test of the 340-350 support area.
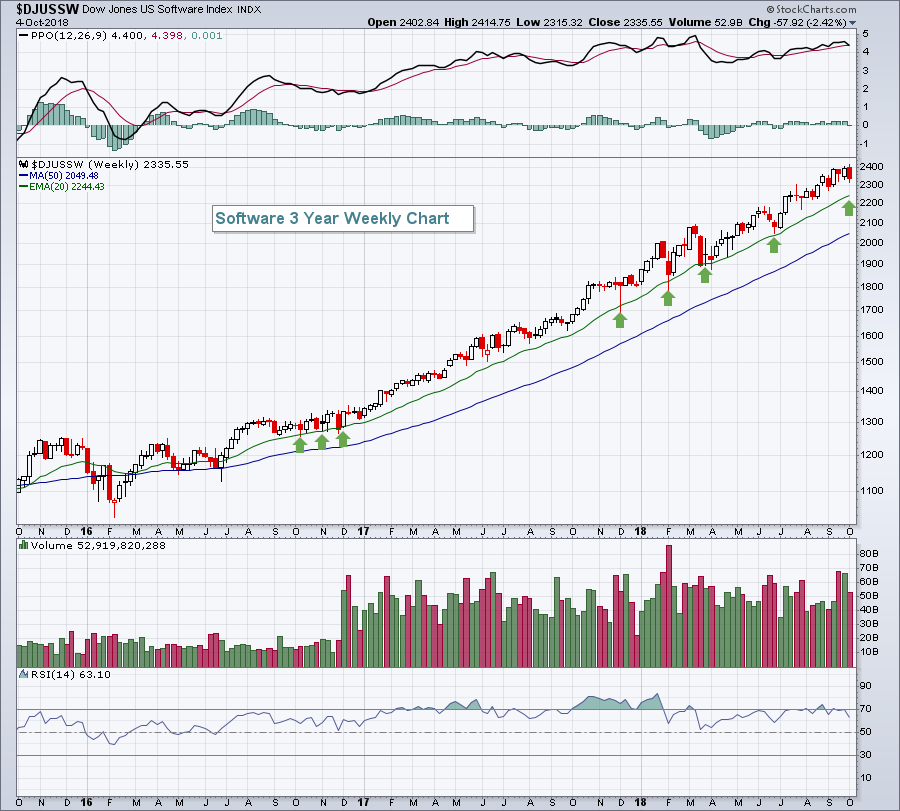
Technology (XLK, -1.80%) was the worst performing sector on Thursday and it was led to the downside by software ($DJUSSW). Prior to yesterday, the DJUSSW had been up more than 30% year-to-date. While we could see more short-term trouble in this area as many individual software stocks lost price support, I do expect to see the index hold its 20 week EMA support as follows:
 It's another 4% or so down to that rising 20 week EMA so the short-term pain could still be rather substantial. Given the number of successful tests there, however, I'd be inclined to buy some of the best software stocks (lean on the SCTRs to help find the best) on that test if it occurs.
Financials (XLF, +0.68%) were the best performing group, gaining mostly due to the rising 10 year treasury yield ($TNX), which closed at 3.20%. Life insurance ($DJUSIL) and banks ($DJUSBK) were among the best performers there, although financial administration stocks ($DJUSFA), the group that's been the biggest winner year-to-date in financials, were hit hard like many of the other great performers of 2018, falling nearly 2%.
Pre-Market Action
The U.S. unemployment rate fell to 3.7% in September, the lowest reading in five decades. That is spooking traders once again today as Dow Jones futures head lower, down 43 points at last check.
Global markets were mostly lower as well. The German DAX ($DAX) is down more than 1%.
Current Outlook
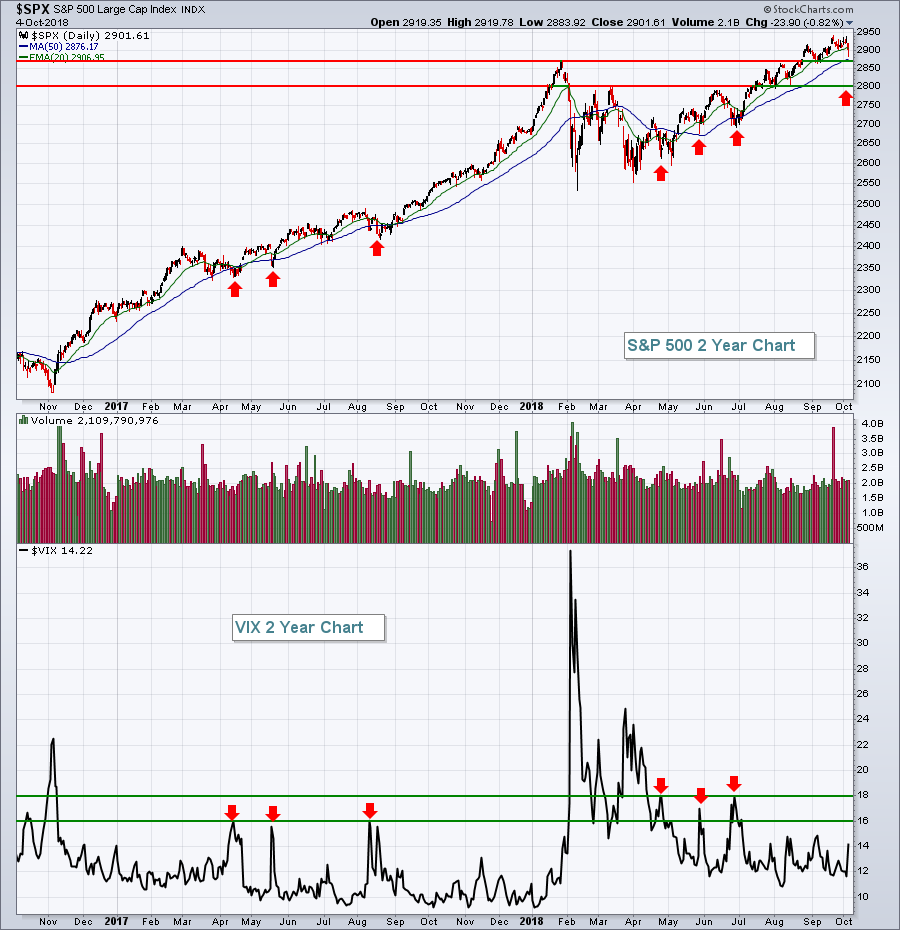
The Volatility Index ($VIX) spiked 22.48% on yesterday's session as fear gripped the market. While the spike could have marked a near-term bottom in the S&P 500, another push in the VIX above Thursday's high would likely signal further panic and perhaps more near-term selling. The levels on the VIX and S&P 500 I'd watch are as follows:
 VIX closes in the 16-18 range have proven on several occasions to be key during this two year uptrend in the S&P 500. If the SPX fails to hold onto support near 2870, I'd look for the VIX to help mark a significant bottom by jumping into that 16-18 range on a closing basis, with a possible intraday spike higher than 18. That spike could accompany an SPX price support test close to 2800, if selling accelerates.
Sector/Industry Watch
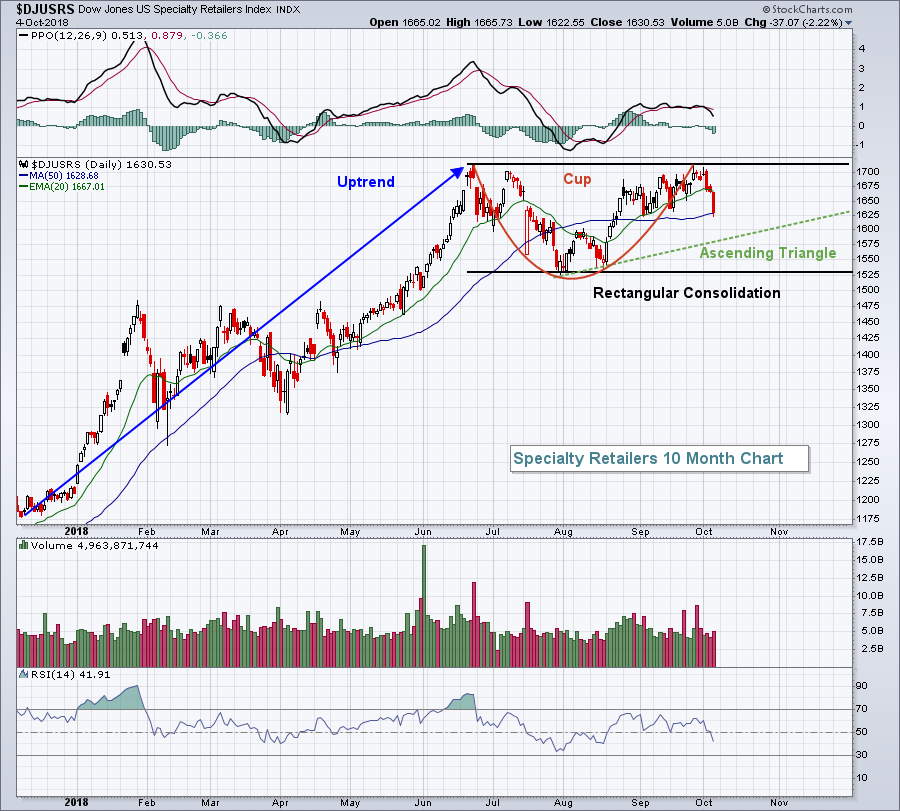
The Dow Jones U.S. Specialty Retailers Index ($DJUSRS) has had three rough days in a row, helping to lead the retail ETF (XRT) lower as well. The DJUSRS tested its price high from June and now is likely settling back into some type of bullish continuation pattern. Here's how the pattern may unfold:
 The one thing that's absolutely crystal clear and really cannot be debated is that the DJUSRS was in an uptrend during the first six months of 2018. From there it gets more interesting. Once I see a clear uptrend in play and a top forms, I look for possible continuation patterns. I've identified three possibilities above. The black annotations outline a potential rectangular consolidation pattern. If the overall stock market is continues to weaken, then August support near 1525 could come into play. The green annotations highlight an upcoming low that would be above the August low to create a pattern of higher lows and a possible ascending triangle pattern. The red annotations suggest we've seen a cup with the current selling representing a handle. It's difficult to say with any certainty what type of pattern will emerge, or if a pattern will emerge at all. But I believe the odds are strong that we haven't seen the ultimate high for specialty retailers. Spotting bullish patterns as they print will increase the likelihood of successful Q4 trades ahead in this space.
Historical Tendencies
Gold mining ($DJUSPM) typically struggles during October. One reason is that over the past 20 years, October has been one of the most bullish months for U.S. equities as traders have ignored gold and gold miners. The DJUSPM is up slightly thus far in October, but has averaged losing 2.7% during October over the past two decades.
Key Earnings Reports
None
Key Economic Reports
September nonfarm payrolls released at 8:30am EST: 134,000 (actual) vs. 180,000 (estimate)
September private payrolls released at 8:30am EST: 121,000 (actual) vs. 175,000 (estimate)
September unemployment rate released at 8:30am EST: 3.7% (actual) vs. 3.8% (estimate)
September average hourly earnings released at 8:30am EST: +0.3% (actual) vs. +0.3% (estimate)
Happy trading!
Tom
