Market Recap for Friday, October 5, 2018
There was good news and bad news Friday on the volatility front. The Volatility Index ($VIX) hit 17.36 intraday on Friday, the highest level of expected volatility since the late-June swoon, and it closed another 4% higher after a big spike on Thursday. High and rising volatility favors the bears in the near-term. The good news for the bulls, however, is that the VIX left a long tail to the upside on Friday and might have peaked. A topping VIX is generally associated with short-term S&P 500 bottoms:
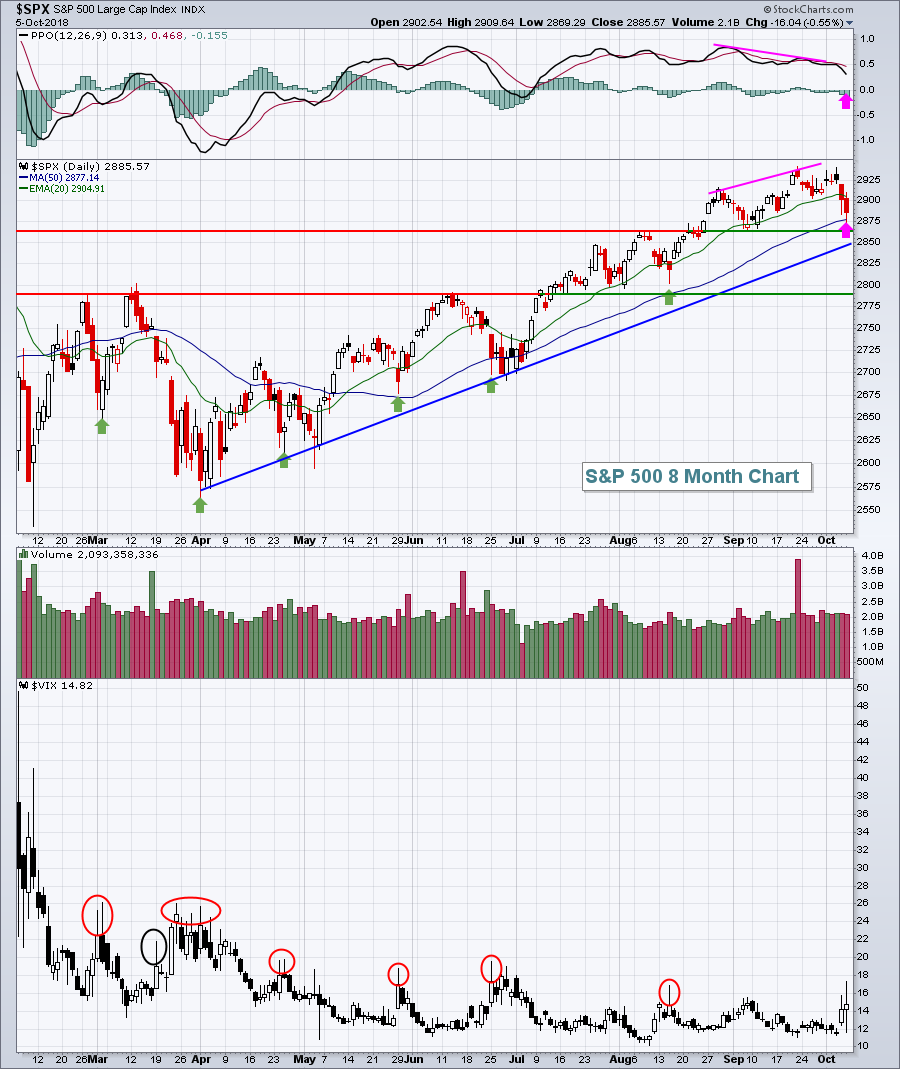 Note that most VIX daily candles with long tails to the top (red circles) coincided with short-term S&P 500 bottoms. There was one in March (black circle), though, that gave us a false signal. So did the VIX reversal in the final two hours on Friday signal an S&P 500 bottom after it tested its 50 day SMA (pink arrow)? The 50 day SMA test was to be expected after the recent negative divergence printed on the mid-September price high. If the S&P 500 drops beneath 2864 on an intraday basis and the VIX takes out Friday's intraday high of 17.36, then short-term traders beware as selling could definitely intensify. We know how quickly the market sells off.
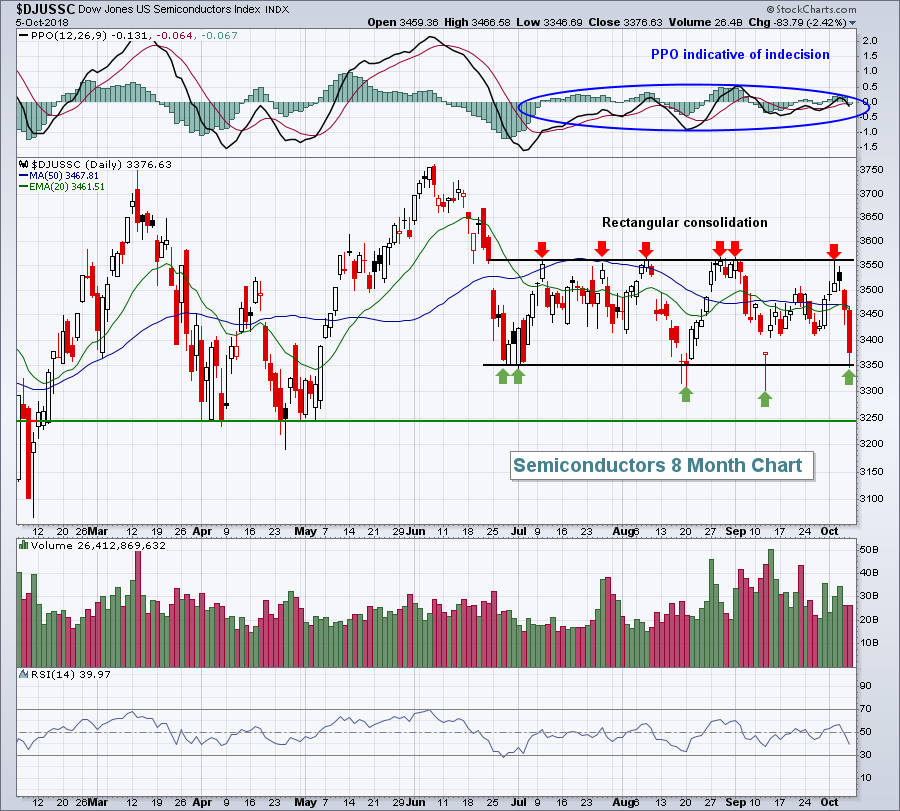
The defensive utilities (XLU, +1.53%) and real estate (XLRE, +0.03%) were the only two sectors to escape the wrath of the sellers on Friday. Technology (XLK, -1.26%) was again very weak as semiconductors ($DJUSSC, -2.42%) endured a horrible end of the week selling binge that featured the group falling from key resistance down to key support:
Consumer discretionary (XLY, -0.75%) stocks were hit hard again, similar to technology, but one key area - apparel retail ($DJUSRA) - reversed on Friday and managed to finish in positive territory. Keep a close eye on the DJUSRA this week, especially the rising 20 week EMA near 960. A close this week beneath 960 could be problematic not only for the DJUSRA, but also for the XLY.
Pre-Market Action
The U.S. bond market is closed today in observance of the Columbus Day holiday, but U.S. equity markets are open as usual and have a normal business schedule, opening at 9:30am EST and closing at 4:00pm EST.
Gold ($GOLD) is down 1.43% this morning and moving closer to key price support at $1180 per ounce. Crude oil ($WTIC) is also down 1.41% to open the week.
China's Shanghai Composite ($SSEC) fell nearly 4% overnight, losing its rising 20 day EMA support after its central bank cut its reserve ratio for lenders. Other Asian markets were lower in sympathy. Weakness is also seen this morning across European markets.
Here in the U.S., Dow Jones futures are lower by more than 100 points with approximately 20 minutes left to the opening bell. Watch the Volatility Index ($VIX) for clues as to further panicked selling this week.
Current Outlook
Ordinarily I'd expect to see light volume today since it's Columbus Day, but if the panicked selling from last week resumes, the volume could be higher than normal. I'm keeping a close eye on the transports ($TRAN) this week. While the group closed beneath their 50 day SMA on Friday, that's not completely unusual given the negative divergence that had printed on the price high in mid-September. A bigger level, in my view, will be the rising 20 week EMA, which generally provides great support during bigger uptrends. Check this out:
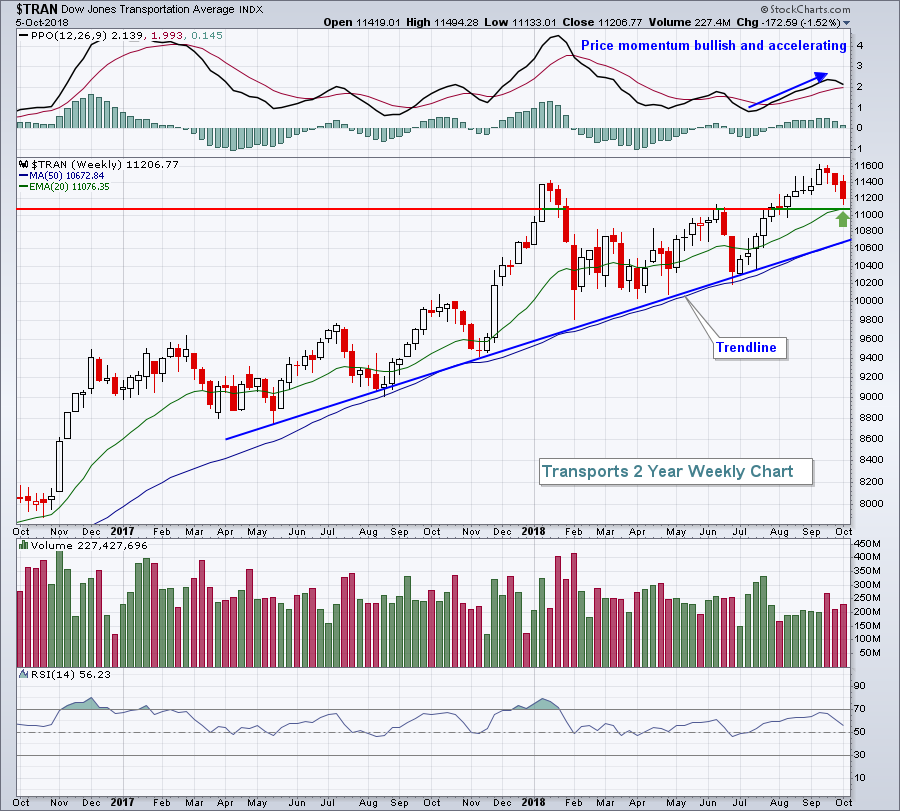 If selling escalates this week and the TRAN fails to hold its rising 20 week EMA support, look to trendline support closer to 10700 or huge price support at 10000. That was the low during the panicked selling in January and February and would likely be heavily supported by longs.
Sector/Industry Watch
Technology (XLK) has been a key leader throughout much of the decade-long bull market. But on a weekly chart, the PPO has not seen a centerline test in 2 1/2 years. If the rising 20 week EMA fails to hold as support, we might see an upcoming PPO centerline test. I believe the odds are that the 20 week EMA holds as it's mostly held on the following chart:
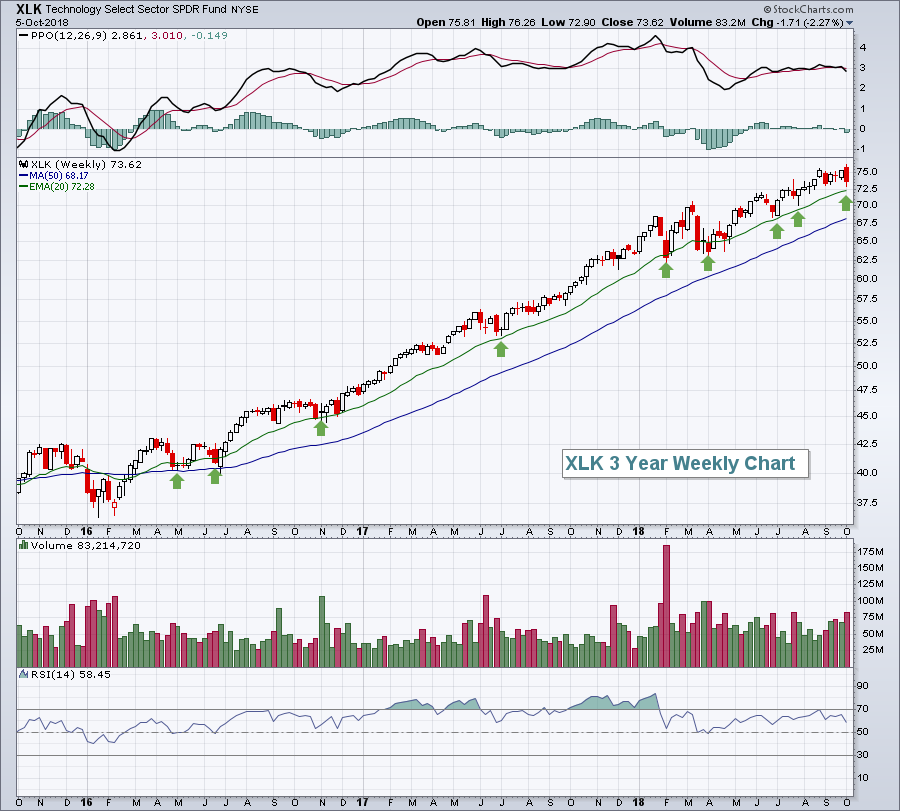 There was a bearish engulfing candle last week so a test of the 20 week EMA should be expected. That would represent another 2% drop at some point this week. Then things will get more interesting.
Monday Setups
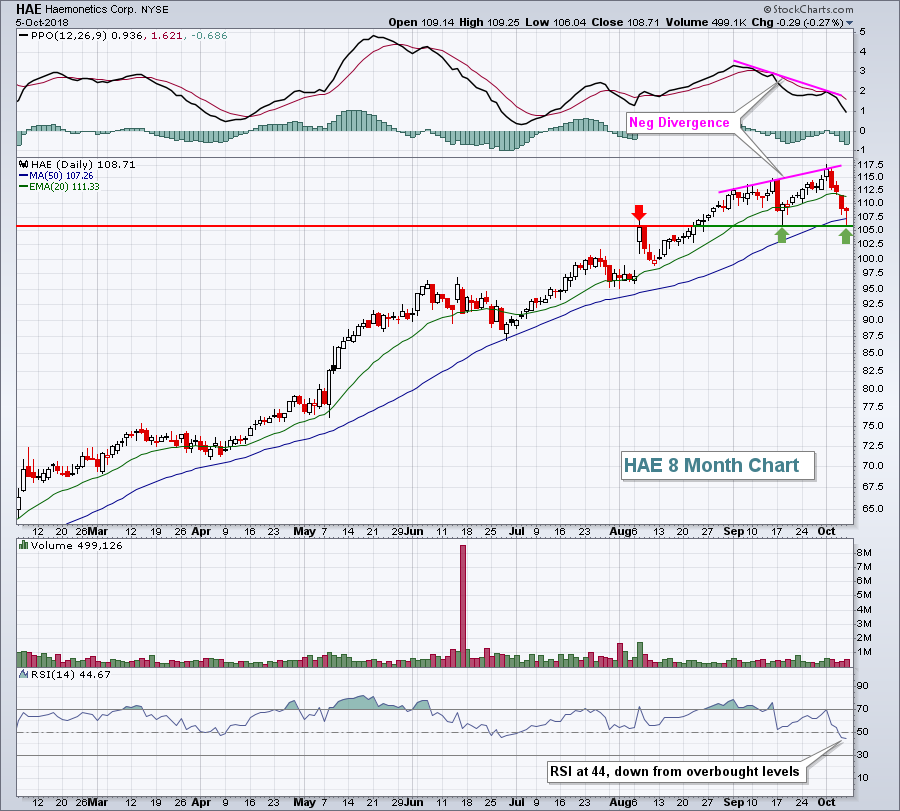
Healthcare (XLV) tested its rising 20 day EMA support after a huge move higher the past few months. Given the market's sudden displeasure with technology and consumer discretionary stocks, perhaps healthcare will be a beneficiary this week. One stock in the sector, Haemonetics Corp (HAE) printed a hammer on price support after testing its 50 day SMA and is worth considering from a reward to risk perspective:
 I'm not providing additional trading candidates - at least not yet - for this week as I want to see the VIX settle down before considering additional long candidates. I might add more setups later this week so be sure to check in from time to time. Here's the LINK. Several stocks from recent weeks' setups lost support with the selling last week and underscores the importance of keeping stops in place. They are never pleasant because it means you're losing money, but they do protect you from much bigger losses.
Historical Tendencies
Mercury Systems (MRCY) has barely sold the past couple days despite the sudden selling in technology. This is worth mentioning because MRCY has tremendous bullish tendencies during Q4 each year. Over the past two decades, MRCY has averaged gaining 1.1% from January through September. During Q4, however, MRCY has averaged gaining an astonishing 23%!!! Is the stock's lack of sellers last week an indication that it's ready for another stellar Q4 run? Time will tell.
Key Earnings Reports
None
Key Economic Reports
None
Happy trading!
Tom

