Market Recap for Wednesday, October 3, 2018
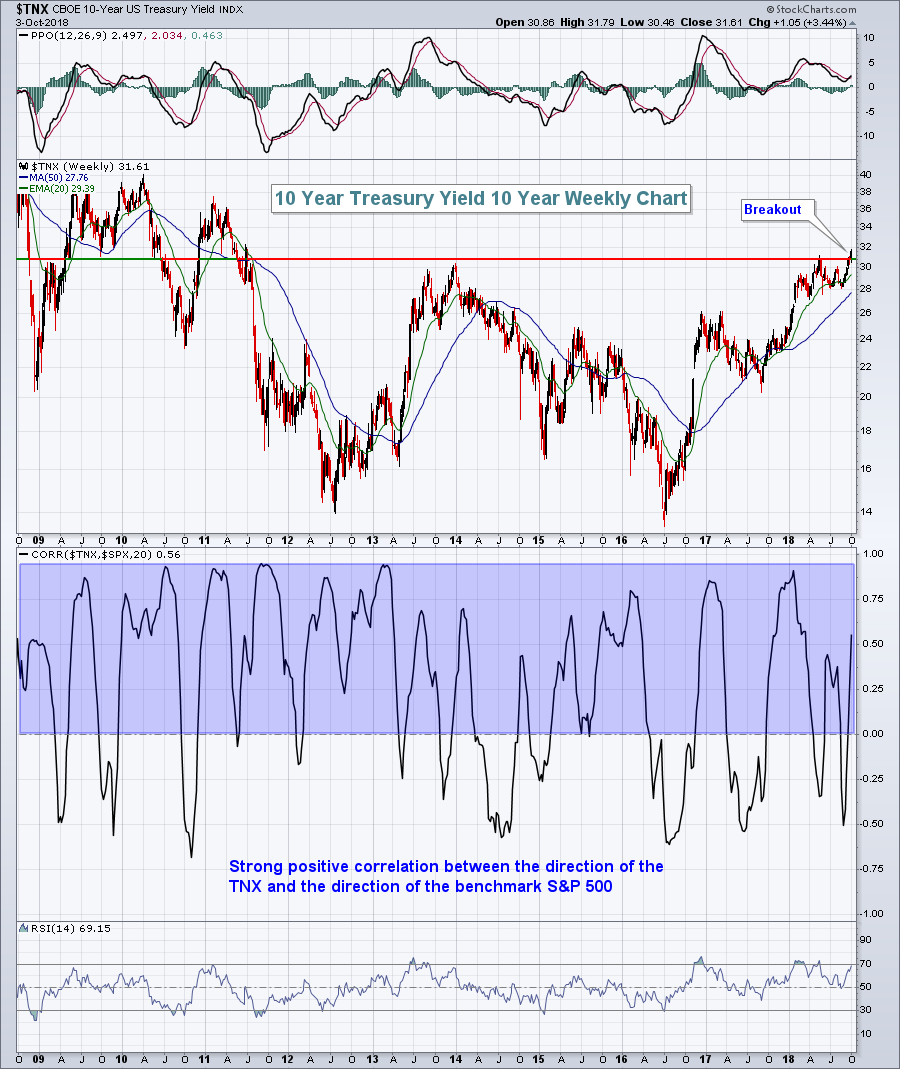
The 10 year treasury yield ($TNX) did the inevitable - it closed above 3.11% and the TNX now resides at a level not seen since 2011. There will be those who say that higher interest rates will be the beginning of our next recession. Eventually they could be right, but in the foreseeable future, I'm not buying it. The Fed's rate hiking campaign, and the subsequent breakout in the TNX, is occurring off historic lows. We haven't been in an environment like our current one since the 1960s. Our economy is growing and we have very low interest rates - by any measure - to help fuel that growth. History also tells us that rising treasury yields drive equity prices higher. Below is a chart of the TNX and it highlights the tight positive correlation between the two:
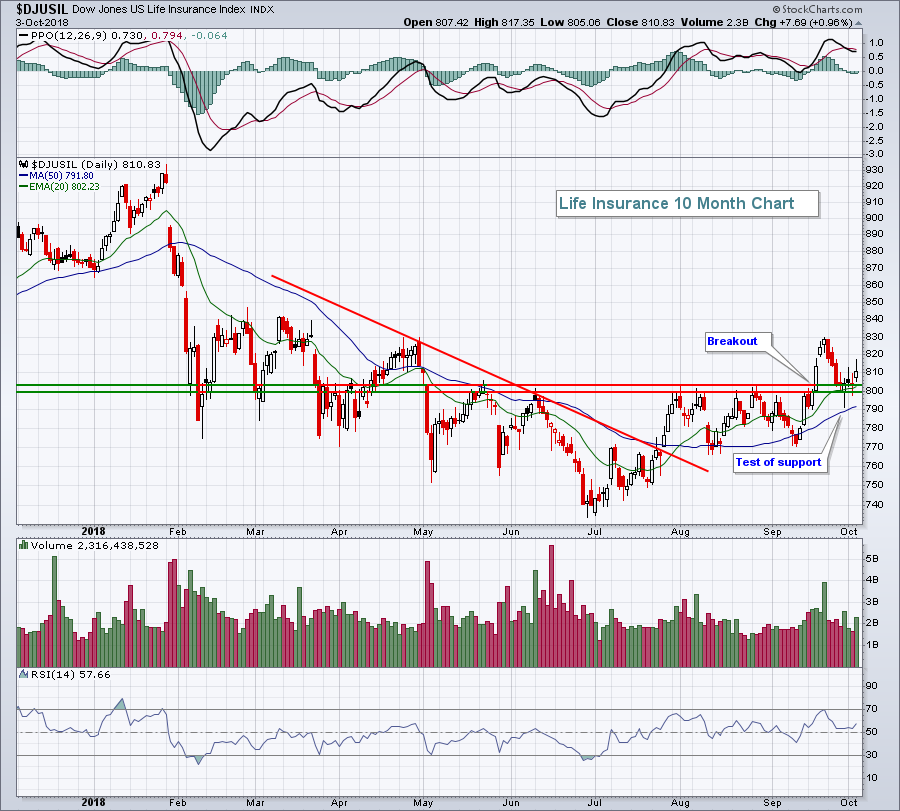
 As rates move higher, financials (XLF, +0.94%) tend to perform well on a relative basis and that was the case on Wednesday. Banks ($DJUSBK, +1.42%) and life insurance ($DJUSIL, +0.96%) led the financial sector and that's generally the case when the TNX is rising. Both groups typically see rising profits in a rising interest rate environment and the market looks ahead. The DJUSIL has been particularly strong of late and acting quite bullishly:
 I expect to see the TNX remain in an uptrend to close out 2018 so the DJUSIL should continue to trend higher as well. The reaction high (from the January-February selloff) in the 840s will pose considerable price resistance. Eventually a breakout there would be extremely bullish for the group.
As should be expected, the defensive groups - utilities (XLU, -1.20%), real estate (XLRE, -1.15%), and consumer staples (XLP, -1.07%) - were sold off on the TNX breakout. They'll likely be fine on their charts from an absolute basis as all sectors tend to participate in bull market rallies, but their relative strength is what I would question.
Pre-Market Action
The 10 year treasury yield ($TNX) has continued its recent surge, today rising another 3 basis points to 3.19%. While U.S. futures are lower in response and the media is touting the higher rates as a reason to sell, I'd caution against that mentality as I discussed above in the Market Recap section. Higher rates, if reflecting a stronger economy, tend to result in money rotating from treasuries to equities. I view the TNX breakout as very bullish for U.S. equities.
We're seeing mixed markets in both Asia and Europe. Dow Jones futures are down 103 points with 30 minutes left to the opening bell.
Current Outlook
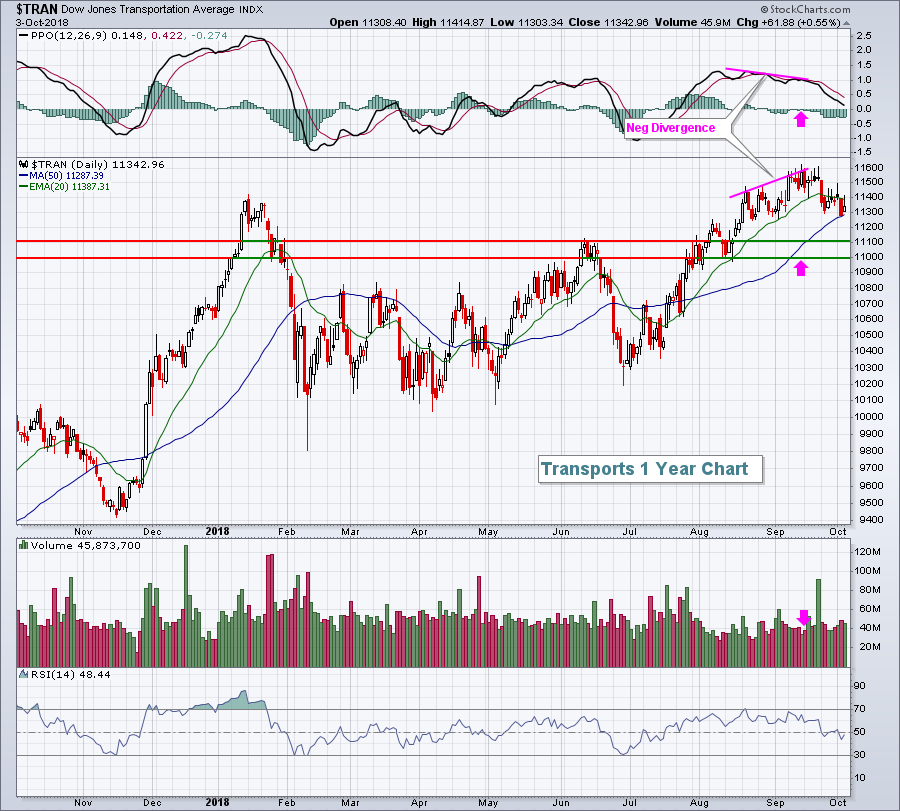
Transportation stocks ($TRAN) should do well as our economy strengthens and they've performed well during 2018, with the one significant exception being the early February swoon with the overall market. On September 17th, I suggested that the TRAN could be in near-term trouble, however, as a negative divergence had printed. That suggests slowing bullish price momentum and the lack of volume to support its breakout at that time confirmed this momentum issue. Transports have since corrected a bit and unwound those momentum issues. The TRAN now looks poised to resume its earlier rally:
 The pink arrows were added to this chart a few weeks ago, suggesting what we might look for after the negative divergence printed. While the actual level of selling hasn't resulted in a price support test, we have seen the PPO move back near centerline support and we have seen a 50 day SMA test. It's certainly possible that we'll see further selling down to the price support zone provided above, but one thing's for sure. The TRAN, at 11342, is a much better reward to risk option than it was a few weeks ago above 11600 and accompanied by a negative divergence. When I speak of "managing risk", this type of price behavior is what I'm usually referring to. Trading the TRAN (IYT is the tracking ETF) with a negative divergence in play would have resulted in capital being tied up for weeks and a 3% loss. I try to avoid trading groups or stocks with negative divergences in play, especially those accompanied by light to moderate volume.
Sector/Industry Watch
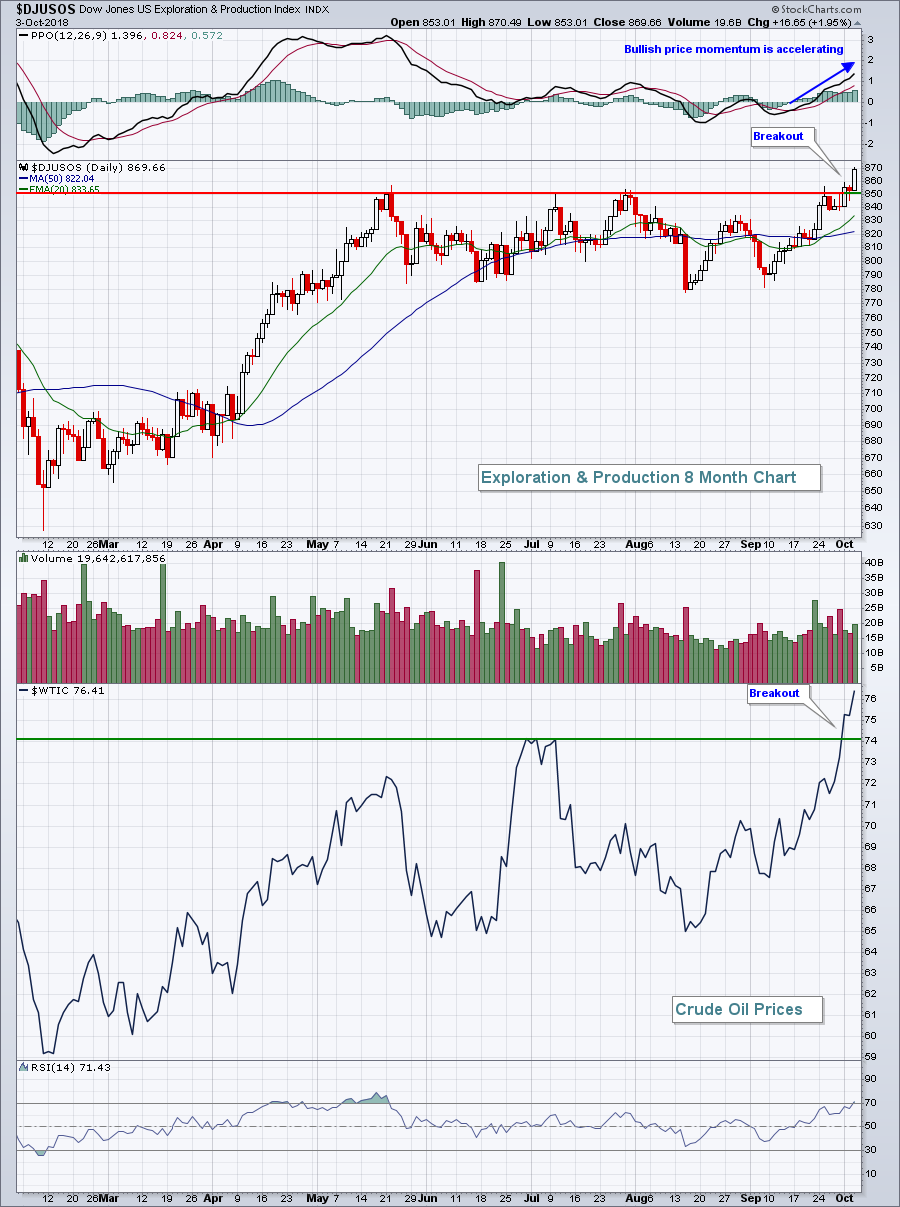
Exploration & production ($DJUSOS) led energy on Wednesday and is clearly the most bullish aspect of energy currently. After breaking out on Monday, we saw a shallow pullback on Tuesday, then another surge yesterday. This is bullish behavior, which makes sense as the DJUSOS has the strongest correlation to crude oil prices ($WTIC), and they've been breaking out in recent days as well:
 The energy ETF (XLE) is attempting a breakout of its own as overhead price resistance the past several months is in the 77-78 area. The XLE closed at 77.49 on Wednesday.
Historical Tendencies
The Dow Jones U.S. Computer Hardware Index ($DJUSCR) is one of the best performing industry groups of 2018. Technically, it remains very strong as we now trade in its historical sweet spot - Q4. Over the past two decades, October has treated this industry group best. The DJUSCR has averaged rising 4.6% during the month of October, which is nearly double the second best calendar month of the year.
Apple, Inc. (AAPL) enjoys Q4, but another computer hardware stock enjoys it even more. Network Appliance (NTAP) has averaged gaining 8.1%, 6.8% and 4.3% during the months of October, November and December, respectively. That's a total of 19.2% that NTAP has appreciated on average over the past 20 years. Quite impressive. AAPL, on the other hand, has only gained an average of 10.1% during Q4.
Key Earnings Reports
(actual vs. estimate):
STZ: 2.87 vs 2.58
(reports after close, estimate provided):
COST: 2.34
Key Economic Reports
Initial jobless claims released at 8:30am EST: 207,000 (actual) vs. 213,000 (estimate)
August factory orders to be released at 10:00am EST: +2.1% (estimate)
Happy trading!
Tom
