Reminder
If you haven't already subscribed to my blog, I'd love to keep you up-to-date on the latest news and technical developments. It's FREE and simple. Scroll down to the bottom of this article and type in your email address in the space provided. Then click the green "Subscribe" button and VOILA! My articles will then be sent to your email address the moment they're published! It's a great feature here at StockCharts.com that can keep you informed of potential trading/investing opportunities and ideas. As always, thank you so much for your support!
Market Recap for Wednesday, June 20, 2018
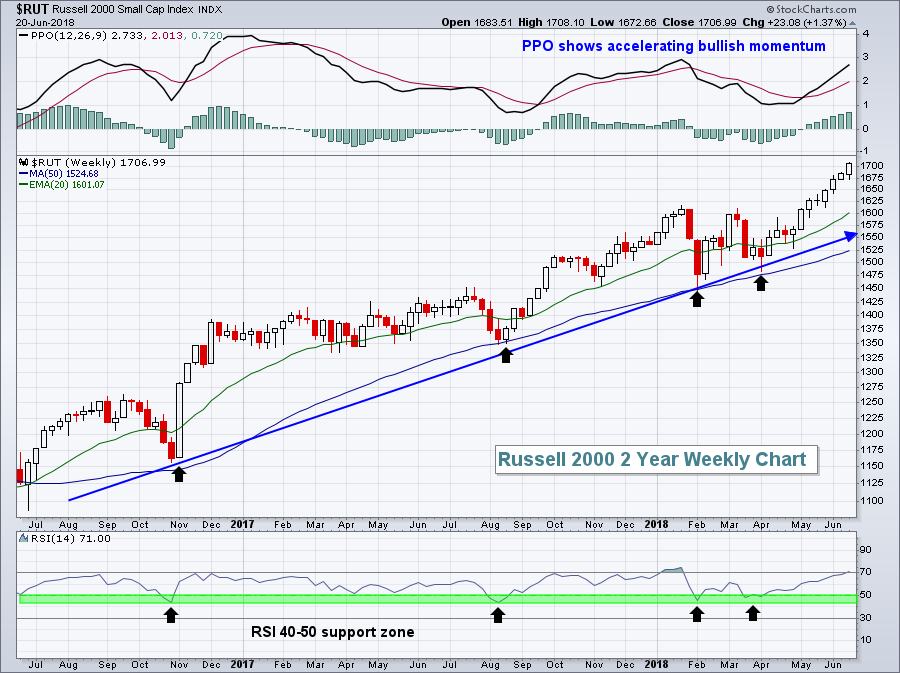
The Dow Jones Industrial Average ($DJI) closed down 42 points on Wednesday, marking its 7th consecutive day of losses for this multinational group of conglomerates. Trade fears and a rising dollar have put tremendous pressure on both the Dow Jones and S&P 500, although the S&P 500 did manage to gain 5 points during yet another session of bifurcated action. While problems surface and mount for many Dow Jones stocks, you'd never know there was any U.S. market weakness by looking at the NASDAQ or Russell 2000 as they both closed at fresh all-time highs once again. Here's a look at the Russell 2000's weekly chart:
 What trade war? Small cap stocks represent U.S. companies that do all or nearly all of its business in the U.S. Strengthening economic conditions here are sending these stocks higher and the rising dollar is creating an environment where money is rotating from large caps to small caps - a win-win for this space. Check out the Current Outlook section below for more details on the dollar and small cap outperformance.
Consumer discretionary (XLY, +0.47%) and energy (XLE, +0.44%) led the sector performance on Wednesday, with the latter buoyed by another strong performance by pipelines ($DJUSPL). That industry group is featured below in the Sector/Industry Watch section of today's blog.
Technology (XLK, +0.21%) took up residence in the 3rd sector spot, highlighted by another very strong day by internet stocks ($DJUSNS). Twitter (TWTR), NetEase.com (NTES) and Facebook (FB) were among the leaders in the internet space with FB closing above 200 for the first time in its history. TWTR has been on an amazing run and its relative strength and heavy volume during the advance reek of accumulation.
Pre-Market Action
Despite a less-than-stellar Philadelphia Fed Survey this morning, the 10 year treasury yield ($TNX) is down just 1 basis point to 2.92%. Gold ($GOLD) is down another $9 per ounce to $1265 this morning as renewed strength in the U.S. Dollar is taking a toll on this metal. Crude oil ($WTIC) is down a bit more than 1% this morning and again testing its recent support in the $64-$65 per barrel range.
Asian markets were mixed overnight, although the Hang Seng Index ($HSI) was notably weak. European indices are mostly lower this morning.
Dow Jones futures are under pressure once again, down 77 points with roughly 45 minutes left to the opening bell. A lower close would mark the Dow's 8th consecutive day of losses as trade fears weigh on this index. NASDAQ futures are fractionally lower and have been outperforming the Dow regularly throughout the Dow's recent weakness.
Current Outlook
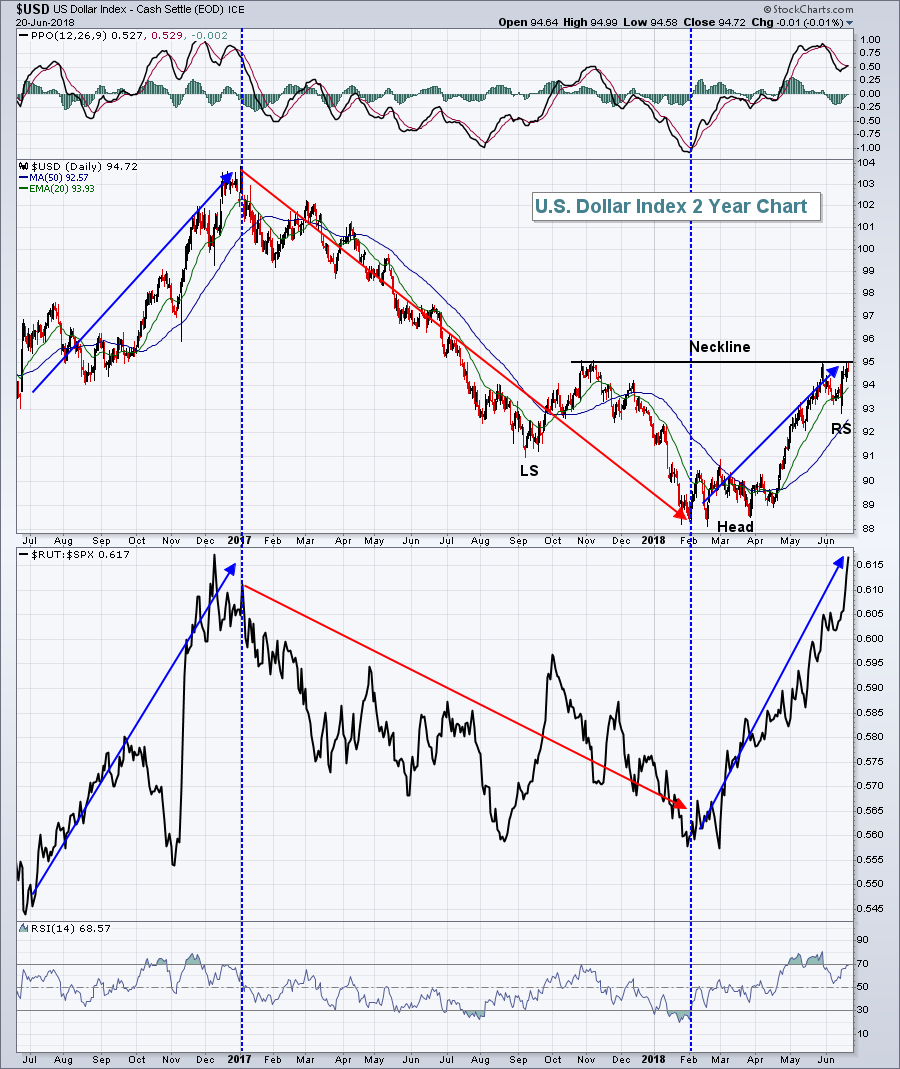
The U.S. Dollar Index ($USD) is testing overhead resistance at 95 once again. The rising dollar has been one of the primary stories of 2018 after a steady decline throughout 2017. Its effect can most clearly be felt in the relative performance of small cap stocks. The Russell 2000 badly lagged the S&P 500 in 2017 as the USD fell from nearly 104 at the start of 2017 to its low near 88.50 in January 2018. That decline propped up S&P 500 earnings as many companies in this benchmark index doubly benefited from overseas profits - once from the profits they earn on revenues there, and later on currency translations. Here were the 2017 gains in these two key indices:
S&P 500: +19.42%
Russell 2000: +13.14%
Perhaps that doesn't seem like a lot to you, but trust me, 6 percentage points in return per year is a big, big difference over a lifetime. Since the USD's low close of 88.50 on February 1st, here are the returns on these two indices:
S&P 500: -1.94%
Russell 2000: +8.05%
From these numbers, hopefully you can better understand how important the dollar's direction can be. Here's the visual:
 The red directional lines show how poorly small caps performed relative to large caps during the 2017 dollar decline. The blue directional lines show you small cap relative strength as the dollar rises. This is a great illustration of what dollar strength/weakness can mean to your trading strategy. The USD is currently testing a very significant neckline resistance at 95. A break above 95 signals to me that we should expect continuing outperformance of small cap stocks.
Sector/Industry Watch
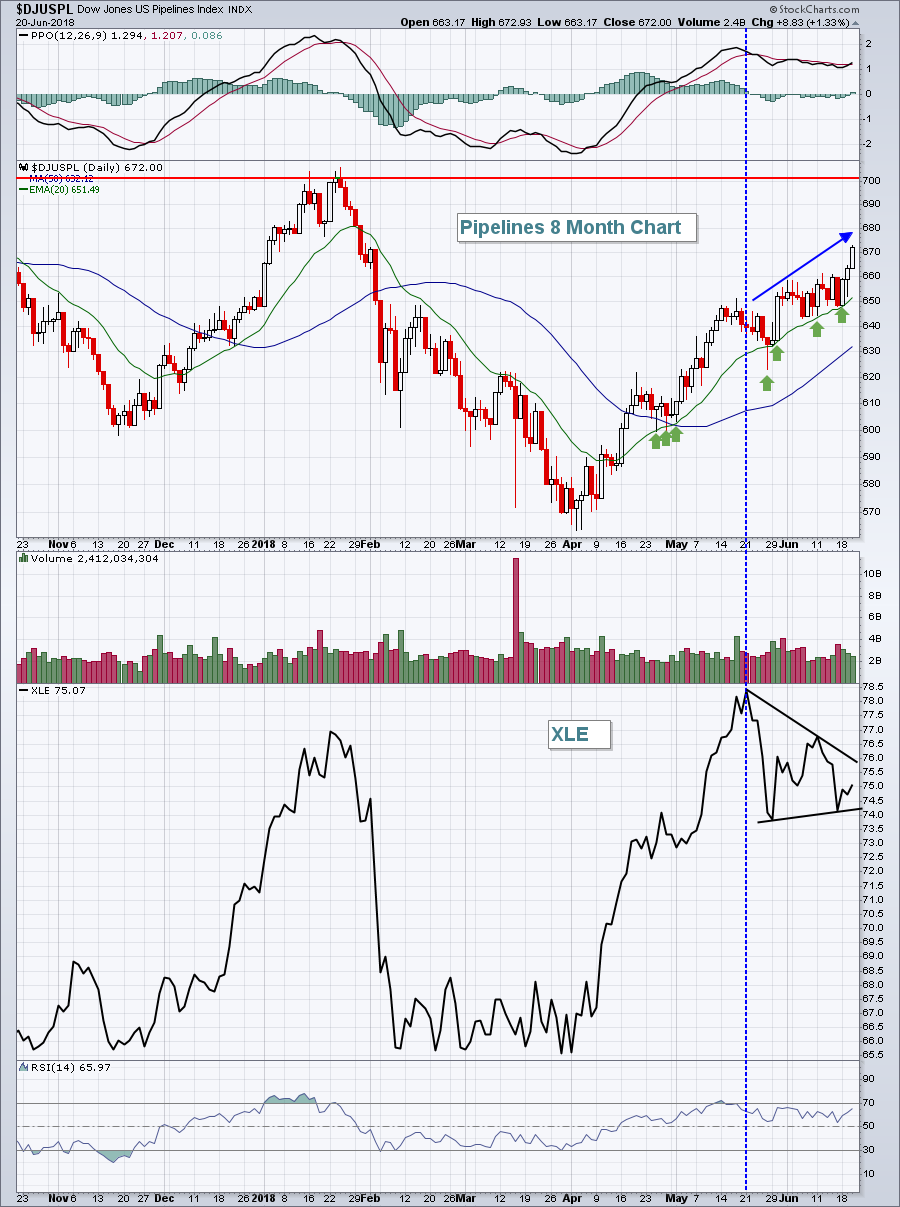
While the overall energy sector (XLE) has been consolidating amid profit taking, the pipeline industry ($DJUSPL) has not. The DJUSPL continues to drive forward and yesterday closed at its highest level since the January 2018 weakness began:
 The last 30 days shows the significant bifurcation between the XLE and DJUSPL. The big reason for this bifurcation is that Exxon Mobil (XOM - 23% of XLE) and Chevron (CVX - 17% of XLE) represent roughly 40% of the XLE. Both of those individual energy stocks have been consolidating the past month, weighing on the XLE. Pipelines, in the meantime, have been bouncing beautifully off of rising 20 day EMA support.
Historical Tendencies
The S&P 500 has been struggling over the past week or so. Part of the problem could be its past more than its present. The June 18th through June 26th period has produced annualized returns of -26.46% since 1950. That's more than 35 percentage points beneath the S&P 500's average annual return of approximately 9% over that same 68 year period.
Key Earnings Reports
(actual vs. estimate):
DRI: 1.39 vs 1.35
KR: .73 vs .63
(reports after close, estimate provided):
RHT: .68
Key Economic Reports
Initial jobless claims released at 8:30am EST: 218,000 (actual) vs. 220,000 (estimate)
June Philadelphia Fed Business Outlook Survey released at 8:30am EST: 19.9 (actual) vs. 28.0 (estimate)
April FHFA house price index to be released at 9:00am EST: +0.5% (estimate)
May leading indicators to be released at 10:00am EST: +0.3% (estimate)
Happy trading!
Tom
