Market Recap for Tuesday, July 18, 2017
It was a rough June for technology stocks and, more specifically, internet stocks ($DJUSNS), but they've both rebounding during an exceptional July. It appears that traders have re-entered this space in anticipation of very strong upcoming quarterly earnings reports. It's been several weeks since I could say this, but the DJUSNS closed at an all-time high on Tuesday, prompting leadership in technology (XLK, +0.46%). The following perfectly illustrates why you do NOT trade topping patterns during a bull market.
DJUSNS as of July 10th:
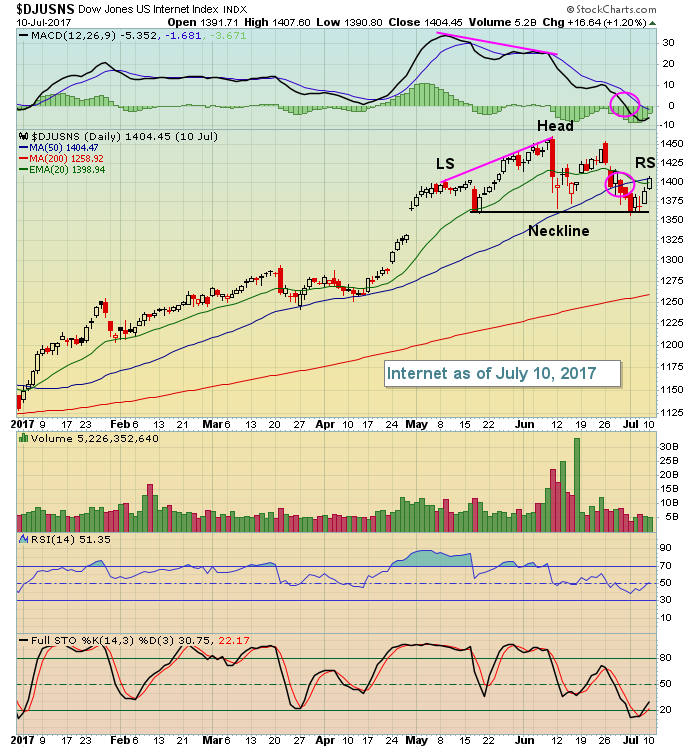 Pretty ominous, right? Well, there are two things to keep in mind. First, note the RSI low at 40. That is a very typical technical development during an uptrend. Second, there was a negative divergence in play so a return to the MACD centerline and/or 50 day SMA (pink circles) was to be expected. After that, however, a topping head & shoulders pattern is not confirmed until a high volume price breakdown occurs. That never happened. Instead, this is how that "pattern" ended:
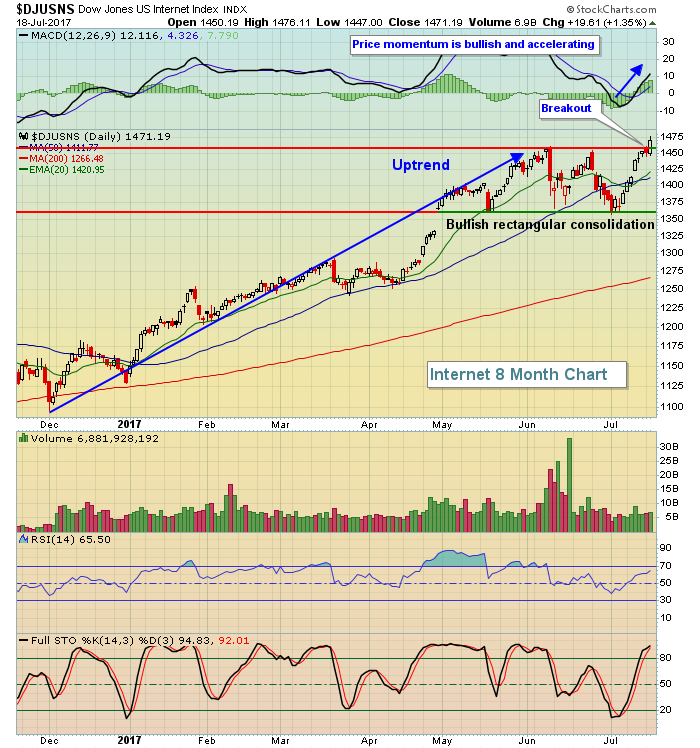 In the end, it wasn't a head & shoulders topping pattern at all. Instead, the DJUSNS consolidated in bullish sideways fashion before breaking out to another all-time high. Unfortunately, some traders take a very pessimistic view of the stock market and try to call market tops prematurely. This bull market is alive and well. When warning signs emerge, taking a cautious view is appropriate, but taking a bearish view is not.
The breakout in internet stocks came at a very good time as it led the NASDAQ to an all-time high close while setting up the technology group for one as well. We could see that as early as today.
Energy (XLE, -0.45%) and materials (XLB, -0.42%) as the former failed once again to close above its declining 50 day SMA, I'd continue to wait for a confirmed breakout above 67 on the XLE before considering a long trade as they're been too many headfakes and false breakouts in 2017. A confirmed high volume close above 67 would likely be the real deal for the XLE.
Pre-Market Action
Home construction ($DJUSHB) should get a lift from a very strong housing starts number this morning. Building permits also beat expectations so the bulls should benefit from a 1-2 punch from the housing group. Earnings are beginning to pour in and most of those earnings were strong this morning. That is helping futures as Dow Jones futures have moved into positive territory, up 4 points with 30 minutes left before the opening bell.
Current Outlook
The price action of late remains quite bullish as it's difficult to ignore all-time closing highs and each of our major indices have experienced that during July. I've discussed warning signs lately dealing mostly with seasonal weakness during summer months and slowing price momentum in the form of negative divergences on the weekly MACD, but we've seen no reversing candles or price support breakdowns of any kind. To see sustained consolidation or selling, we'll likely need to see both.
One other shorter-term momentum issue has surfaced on the recent price highs. The NASDAQ's been very strong the past few sessions, but it's breakout yesterday occurred with a 60 minute negative divergence. Check this out:
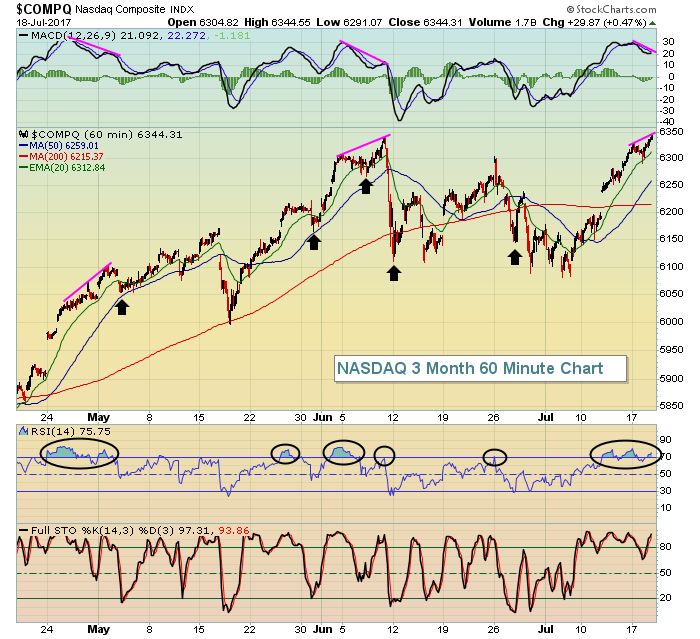 The first 5 black circles on the RSI above represent short-term overbought conditions and the black arrows on the price chart show the pullbacks that have followed - some brief selling episodes with others a bit more intense. We've now remained overbought for the past week on this 60 minute chart with very little selling. I'd look for at least a bit of profit taking to begin fairly soon.
Keep in mind that today is the 19th calendar day of the month. Since 1950 on the S&P 500, the 19th calendar day of all months has produced annualized returns of -33.87%, easily making the 19th the most bearish day of the calendar month. Futures are pointing to a slightly positive open, however, so if today is going to be bearish, it'll likely need to coordinate a selling effort after the market opens.
Sector/Industry Watch
The Dow Jones U.S. Gambling Index ($DJUSCA) looked scary for several days, but the selling took its RSI down to 40 and now the group appears to be regaining its footing after testing price and gap support. Check this out:
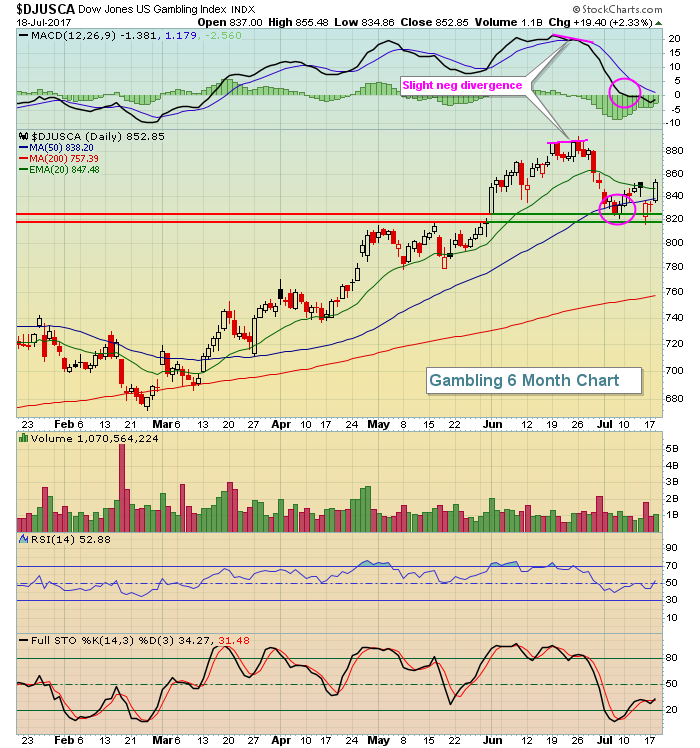 The rebound in gambling stocks, along with strength in specialty retailers ($DJUSRS), enabled consumer discretionary (XLY, +0.45%) to help lead the NASDAQ higher on Tuesday. I'd continue to view the DJUSCA quite bullishly as long as price support near 820 holds.
Historical Tendencies
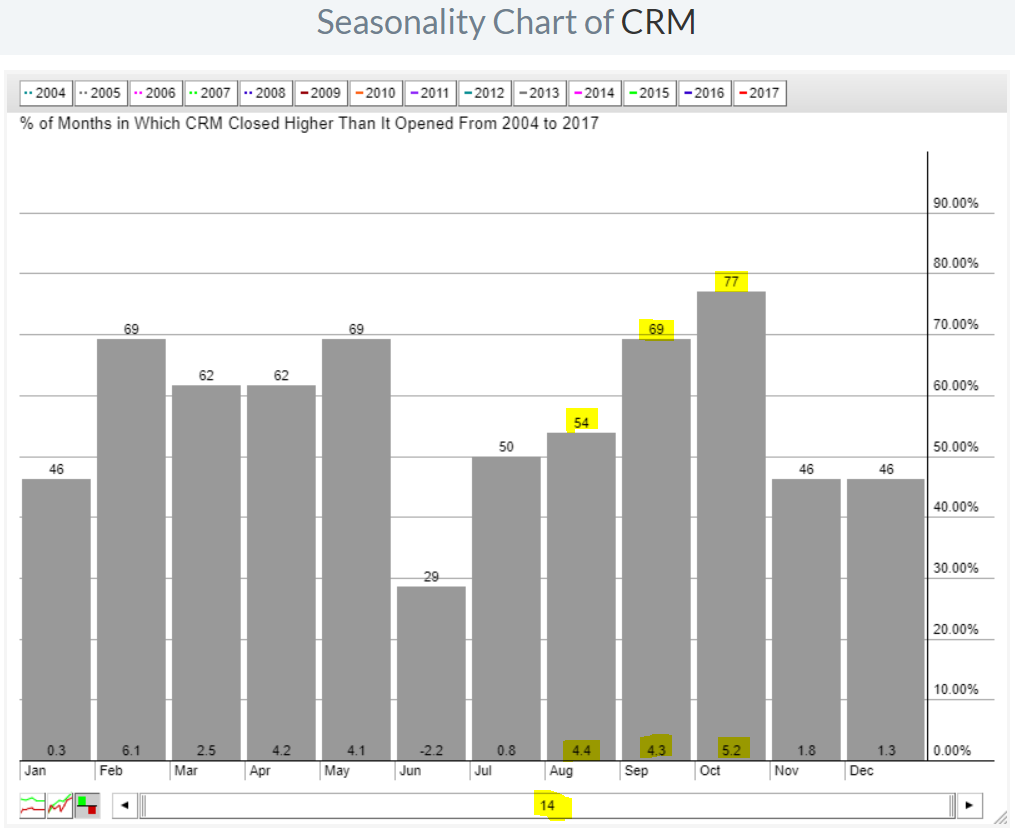
Looking ahead, Salesforce.com (CRM) enjoys its three best consecutive calendar month period beginning August 1st. This seasonal strength can be seen below:
 Technically, CRM recently broke out above prior highs near 84 - but on less than average volume. However, CRM has held its breakout level and price momentum remains strong. Here's the chart:
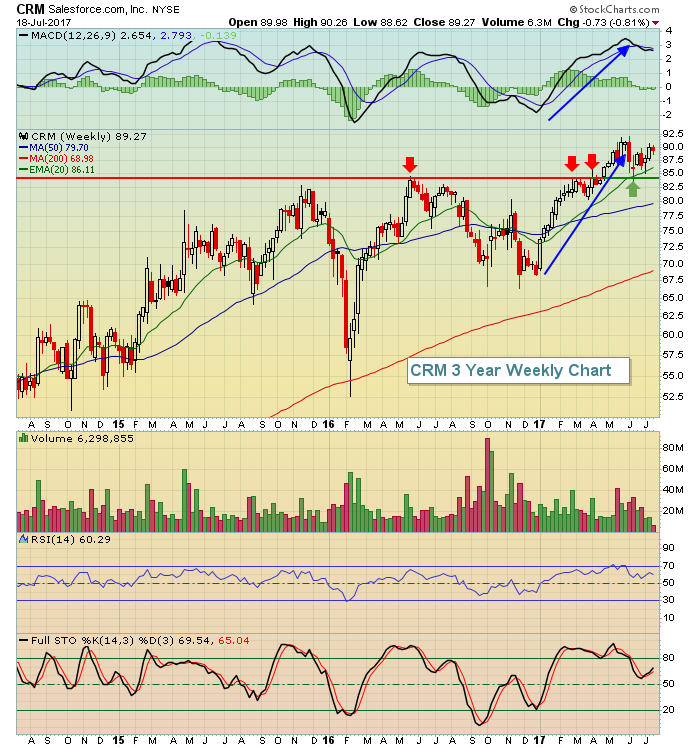 Given the upcoming seasonal strength, CRM would look like a solid reward to risk trade on the long side on any 20 day EMA test. Consider using 84 as a weekly closing stop.
Key Earnings Reports
(actual vs. estimate):
AGR: .46 vs .37
ASML: 1.08 vs 1.06
CCI: 1.20 vs 1.15
MS: .87 vs .76
MTB: 2.38 vs 2.28
TXT: .60 vs .55
USB: .85 vs .84
(reports after close, estimate provided):
AXP: 1.46
CP: 2.05
KMI: .14
QCOM: .67
TMUS: .36
Key Economic Reports
June housing starts released at 8:30am EST: 1,215,000 (actual) vs. 1,170,000 (estimate)
June building permits released at 8:30am EST: 1,254,000 (actual) vs. 1,206,000 (estimate)
Happy trading!
Tom
