Market Recap for Wednesday, July 19, 2017
Energy (XLE, +1.46%) and materials (XLB, +0.96%) led the major U.S. indices to all-time highs on Wednesday, with particular strength in coal ($DJUSCL) and renewable energy ($DWCREE), which rose 6.36% and 3.08%, respectively. The former's strength comes on the heels of a bottoming head & shoulders breakout as reflected below:
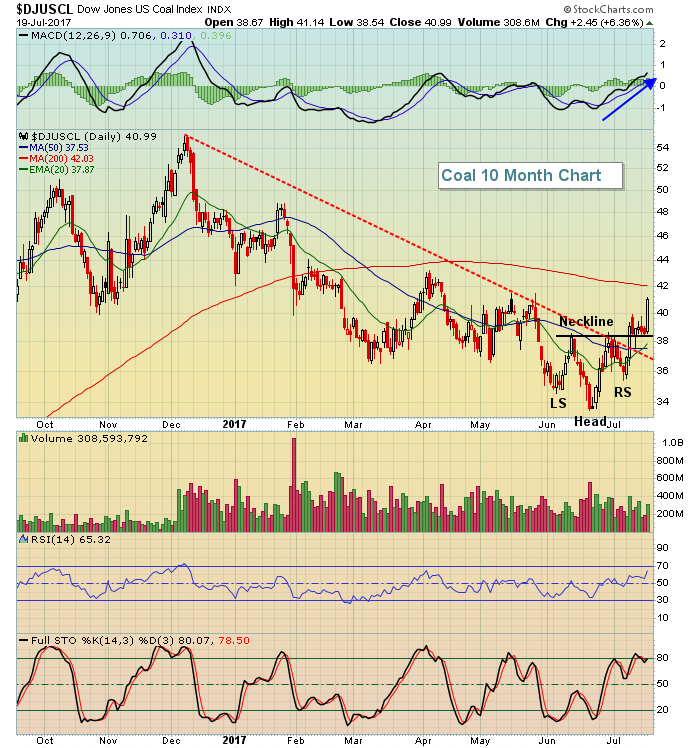 After the reverse head & shoulders breakout, the DJUSCL backtested that breakout level near 38.50 before pushing to new highs yesterday. The daily MACD recently printed a bullish crossover and momentum here appears to be accelerating. The initial measurement of this pattern is to the 43.00-43.50 area, which would test previous highs from February and April.
Renewable energy looks even better and this is a volatile group that can move very quickly in both directions. Here's the updated technical view on the DWCREE:
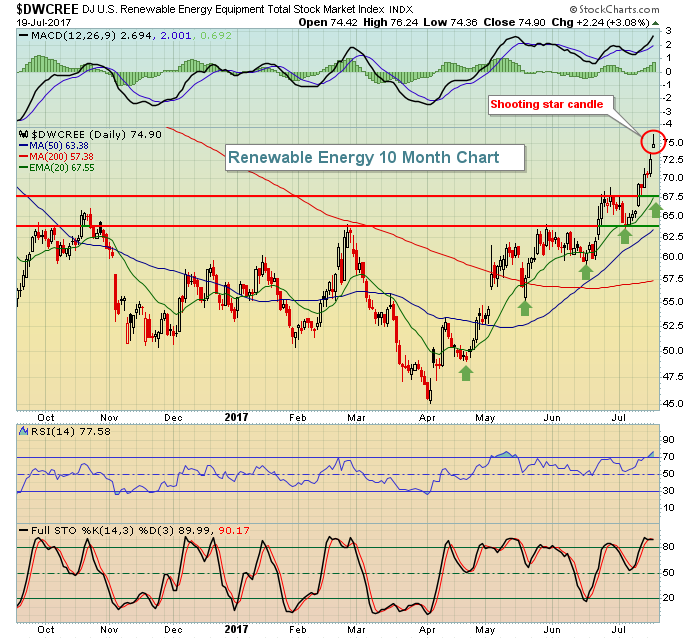 The green arrows have marked fairly solid support along the rising 20 day EMA throughout this uptrend so consider the current 20 day EMA at 67.55 to be rather strong support as we move forward. The DWCREE is overbought in the near-term and the shooting star candle that printed on Wednesday is a reversing candle. A gap lower today would leave that action on an "island" as well.
All nine sectors finished higher on Wednesday, although recent leaders financials (XLF, +0.04%) and industrials (XLI, +0.10%) were clearly laggards with the 10 year treasury yield ($TNX) failing to bounce off gap support near 2.27%. Asset managers ($DJUSAG) were particularly weak as Northern Trust (NTRS) reported quarterly EPS below expectations. Despite that miss and the weakness in the DJUSAG, both remain firmly entrenched in longer-term uptrends and should withstand the current weakness to move to fresh new highs later this year. The DJUSAG is featured below in the Sector/Industry Watch section.
Pre-Market Action
Crude oil ($WTIC) closed at its highest level since early June on Wednesday and black gold is up another 0.70% this morning. Gold ($GOLD) is down slightly, at least temporarily halting its recent strength where it's seen higher closed 7 of the past 8 trading sessions. ECB President Mario Draghi's comments this morning on ECB asset purchases has the euro rising against the dollar, however, so the short-term weakness in gold may be short-lived.
The global surge in equities continues this morning. All of the major indices in Asia were higher overnight with the Hang Seng Index ($HSI) pushing closer and closer to its decade-long high just above 28000 that was reached in 2015. European indices are higher, although the German DAX ($DAX) continues to trade beneath both its 20 day and 50 day moving averages. That's a concern.
With 30 minutes left to the opening bell, U.S. stock futures are slightly higher and set to resume their recent torrid pace higher. Dow Jones futures are up by 3 points.
Current Outlook
This is the time of the year and time of the summer when U.S. stocks tend to struggle. While I am always aware of seasonal periods of strength and weakness, nothing tops technical price action. Right now, all of our major indices remain in all-time high territory. To begin thinking more bearishly about summer action, the following chart will be one to keep an eye on.
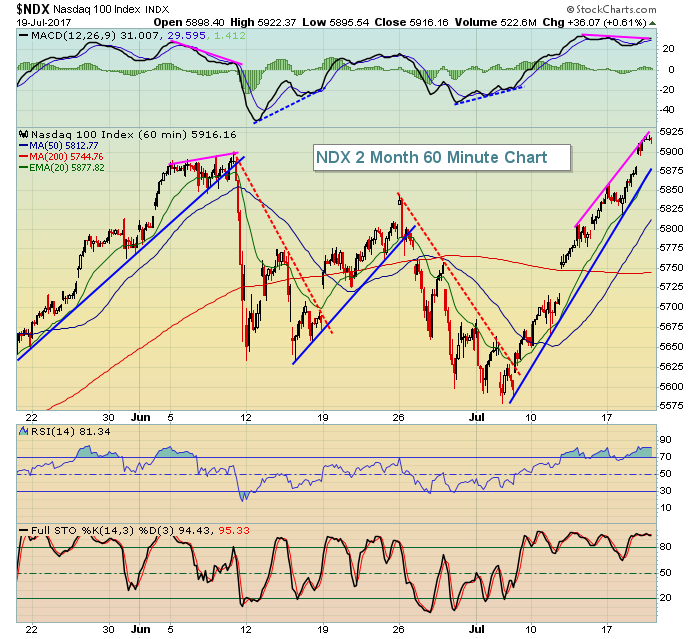 The combination of short-term overbought RSI (above 70), negative divergences and trendline breaks have resulted in periods of selling on the NASDAQ 100. If you're interested in profiting from weakness in the NDX, I think it's important to see this uptrend line break first. Bull markets can be extremely powerful and short-term advances can last much longer than any us might imagine. So use patience and discipline to at least see a trendline break before pulling the trigger on any short positions.
Sector/Industry Watch
The Dow Jones U.S. Asset Managers Index ($DJUSAG) struggled on Wednesday and was the only industry group within financials to finish in negative territory, falling 0.76%. The DJUSAG, however, broke out in a major way on its long-term chart in early June so I fully expect that this run isn't over. Here's the chart:
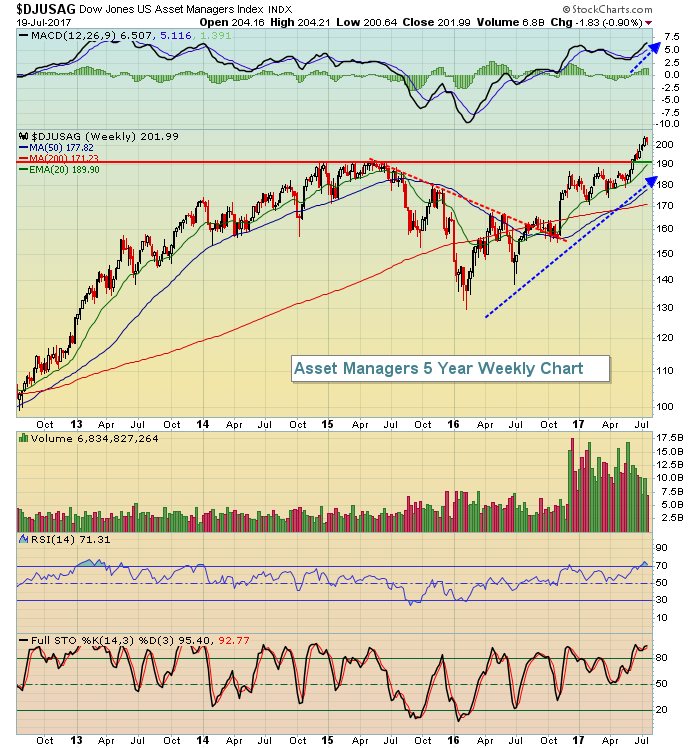 The first real bullish price move was the trendline break last summer, which started the current uptrend. The price breakout above 190 really seals the deal technically. The rising 20 week EMA is now at 190 as well, so that marks the major support level for this index going forward.
Historical Tendencies
Transportation stocks ($TRAN) held a key level of support on Wednesday, closing at 9575, as its rising 20 day EMA is currently 9574. That support level was seriously threatened though as TRAN's intraday low touched 9535. I'd expect the TRAN to recover off yesterday's hammer on support. If it doesn't, you need to be aware that August has easily been the TRAN's worst calendar month of the year over the past two decades. Check this out:
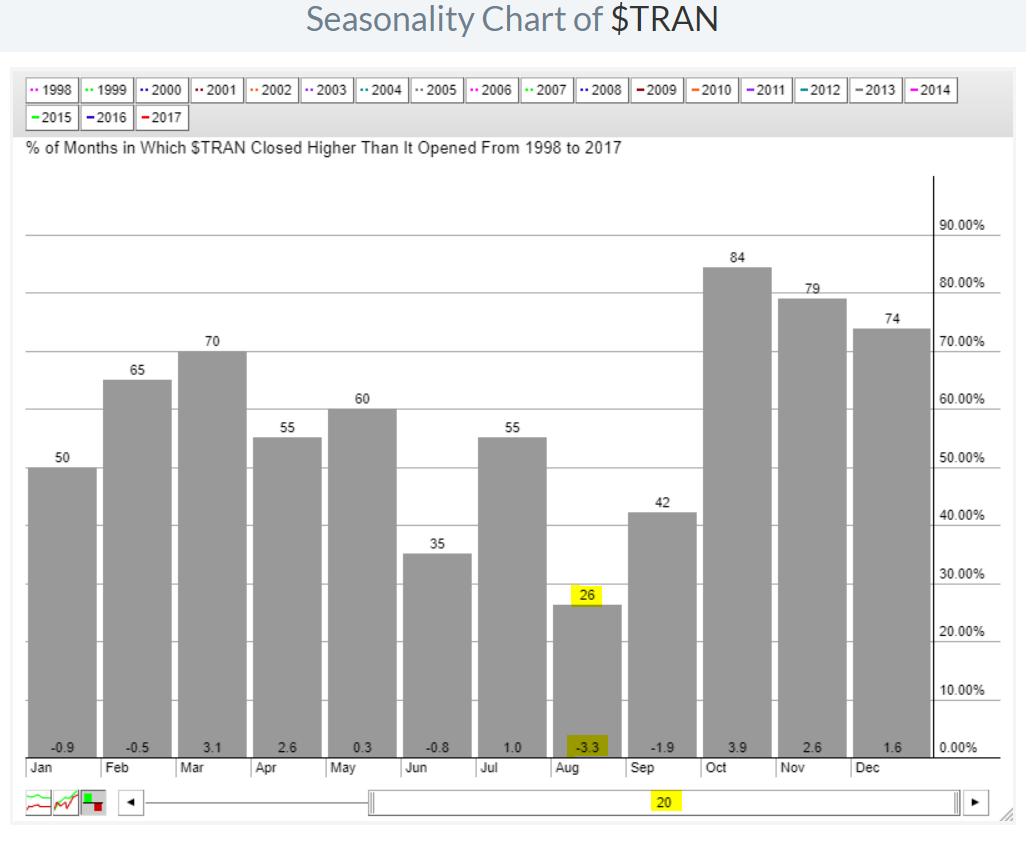 Transportation stocks have averaged declining 3.3% over the past 20 years and it doesn't get much better in September where the TRAN has averaged falling another 1.9%. That's a total of 5.2% that the TRAN typically gives up during August and September in a given year. That's fairly bearish so keep it in mind if bullish technical conditions begin to deteriorate.
Key Earnings Reports
(actual vs. estimate):
ABB: .30 vs .29
ABT: .62 vs .60
BBT: .78 vs .77
BK: .92 vs .84
BX: .59 vs .60
DHR: .99 vs .97
KEY: .34 vs .34
PM: 1.14 vs 1.23
PPG: 1.83 vs 1.80
RCI: .74 vs .71
SAP: .76 vs 1.03
SHW: 4.52 vs 4.55
TRV: 1.92 vs 2.08
UNP: 1.45 vs 1.37
(reports after close, estimate provided):
COF: 1.90
EBAY: .36
ISRG: 4.86
MSFT: .71
SWKS: 1.42
V: .81
WIT: .06
Key Economic Reports
Initial jobless claims released at 8:30am EST: 233,000 (actual) vs. 246,000 (estimate)
July Philadelphia Fed Survey released at 8:30am EST: 19.5 (actual) vs. 22.0 (estimate)
June leading indicators to be released at 10:00am EST: +0.4% (estimate)
Happy trading!
Tom
