Market Recap for Friday, July 21, 2017
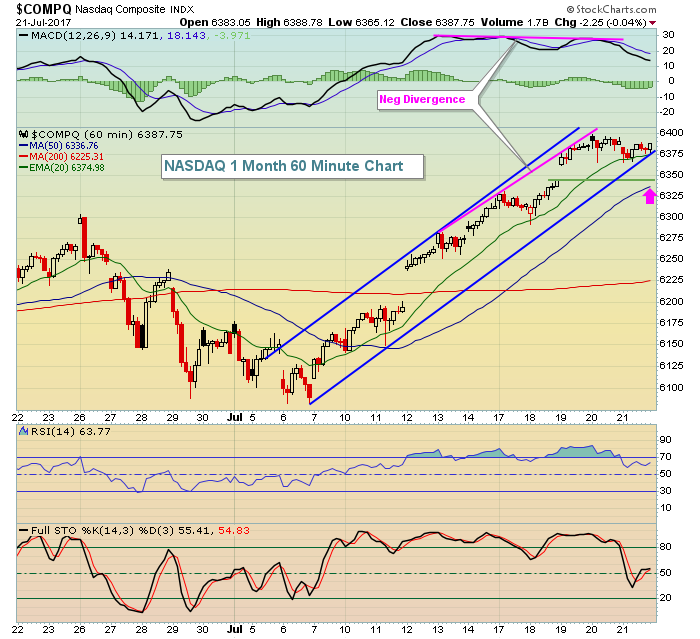
Friday was definitely a boring kind of day, but the bulls will generally take boring - especially after a nice push higher and a huge slate of earnings about to be released this week. While all of our major indices finished Friday on the negative side, only the Dow Jones was unable to finish the week higher. The NASDAQ was the leader last week, rising more than 1%, but even this index struggled the second half of the week, battling a 60 minute negative divergence. Here's the visual:
 Late on Friday, the NASDAQ did bounce to keep its up channel intact, but it's getting perilously close to a short-term breakdown, which would likely lead to a test of gap support and the rising 20 hour EMA. Negative divergences generally follow two patterns - either quick short-term selling or sideways consolidation to allow the rising 50 hour SMA to reach prices from underneath.
The only two sectors that provided much excitement on Friday were utilities (XLU, +0.72%) and energy (XLE, -0.99%). The XLU benefited from another weak performance from the 10 year treasury yield ($TNX). A falling TNX typically favors utilities as it makes their yields more attractive to income investors. The TNX has been steadily declining in July, falling from the peak it reached at 2.40% in early July. The XLE's weakness
Pre-Market Action
This is going to be a very interesting week. The Fed meets tomorrow and Wednesday to determine its next course of action relating to interest rates. While another rate increase would shock the market and is unlikely, traders will be watching closely as Fed Chair Yellen describes what the Fed might be doing or looking for in the second half of 2017. Then there are more housing reports due out this week and....oh yeah! - Earnings reports. Tonight, we'll get the latest report from Alphabet (GOOGL). Ever heard of them?
As we begin a new trading week, U.S. stock futures are flat. Both crude oil ($WTIC) and gold ($GOLD) are rising as the U.S. dollar ($USD) continues its almost daily decline. The USD has fallen nearly 10% since the start of 2017. Asian markets were mixed overnight and we're seeing the same mixed action in Europe.
Current Outlook
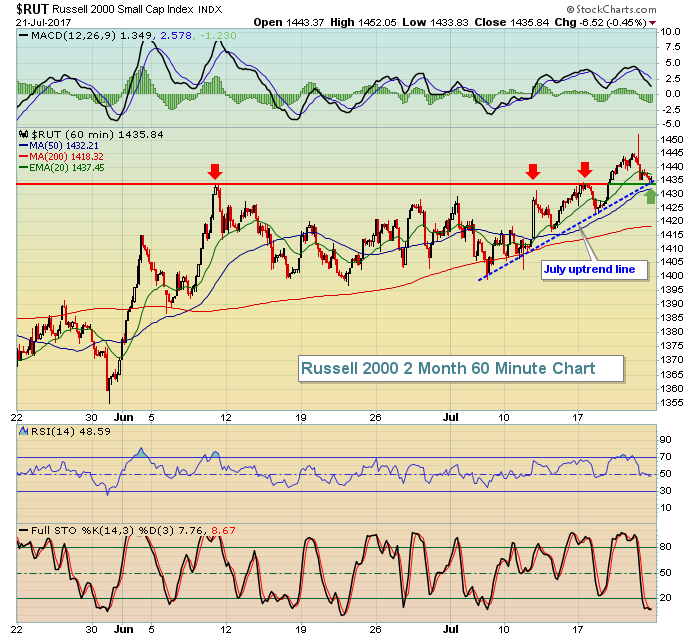
The Russell 2000 (RUT) took the brunt of the selling on Friday, but it's now resting at a key short-term price level on its 60 minute chart as you can see below:
 The red arrows mark multiple tops at or near 1434-1435 before breaking out last week. There's a very basic technical analysis principle that states that "broken price resistance becomes price support". So we should expect buyers to emerge at that 1434-1435 level. Also, check out the July uptrend line that connects previous July price lows. That trendline now intersects that 1435 level as well. Traders will be very interested to see what happens in today's early action. Selling in early action could trigger more selling if both price and trendline support are lost.
Sector/Industry Watch
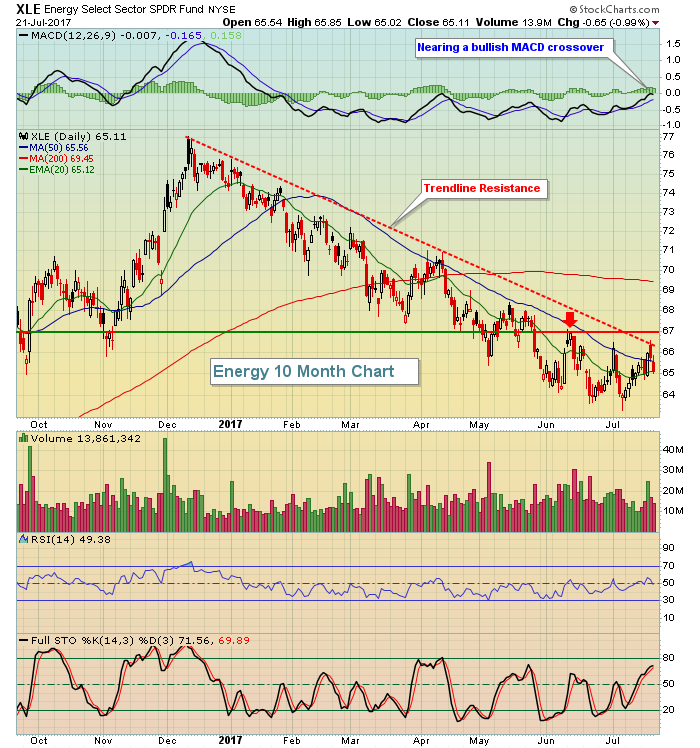
Energy (XLE) again approached its key downtrend line and what I consider to be important price resistance at 67.00. A break of both will likely trigger more technical buying in the group. Here's the chart:
 Thursday's failure at trendline resistance likely spooked buyers on Friday. Look for that break above 67.00 as it would solve a few different technical issues. Note that the daily MACD has been mired beneath its centerline throughout this downtrend. We're close to a bullish MACD crossover into positive territory and that, along with price and trendline breakouts, would be a very positive technical development for the energy group.
Monday Setups
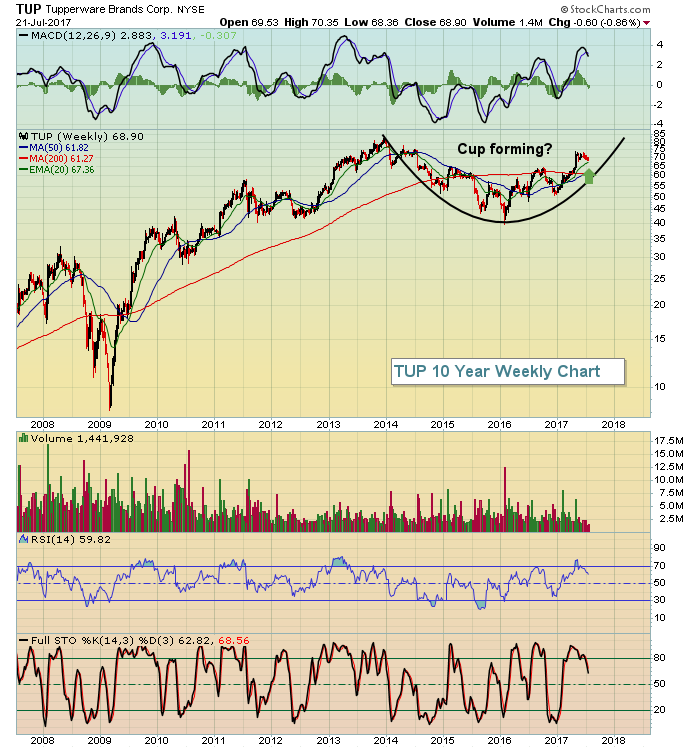
Tupperware (TUP) looks like a solid trading candidate from both a short-term and longer-term perspective, but I'll look at the longer-term weekly chart to identify what I believe is a solid reward to risk trade. First, check out the chart:
The green arrow marks the rising 20 week EMA, which is currently at 67.36, slightly below the current price. I like entry at the current price (68.90) and again at that 20 week EMA, with a closing stop beneath 64.50. My target would be the early 2014 high at approximately 84.
Tune in to MarketWatchers LIVE today at noon EST and Erin Heim and I will reveal our top picks this week. CLICK HERE any time after 11:45am EST this morning to join the show!
Historical Tendencies
Last week was a seasonally bearish week, yet the bulls were able to maintain the upper hand. As we enter a fresh new trading week, the seasonal winds will change direction. July 24th (today) has been a neutral kind of day, but July 25th (tomorrow) kicks off a modestly bullish period that runs through August 2nd (next Wednesday). This period has produced annualized returns of +18.57% since 1950 on the S&P 500.
From now until the end of summer, there aren't many historical bullish periods and the above-described period is the best - not great, but better than any other period through late September.
Key Earnings Reports
(actual vs. estimate):
HAL: .23 vs .19
HAS: .53 vs .46
ITW: 1.66 vs 1.63
PHG: .20 vs .20
RYAAY: 1.78 vs 1.48
SWK: 2.01 vs 1.96
VFC: .29 vs .28
(reports after close, estimate provided):
APC: (.34)
CE: 1.74
GOOGL: 8.20
Key Economic Reports
July PMI to be released at 9:45am EST: 53.2 (estimate)
June existing home sales to be released at 10:00am EST: 5,580,000 (estimate)
Happy trading!
Tom

