Don't Ignore This Chart! October 31, 2018 at 10:04 AM

Soup season is upon us, but Campbell Soup ($CPB) is having none of it as the stock trends lower and lags its sector, the Consumer Staples SPDR (XLP)... Read More
Don't Ignore This Chart! October 30, 2018 at 07:21 PM
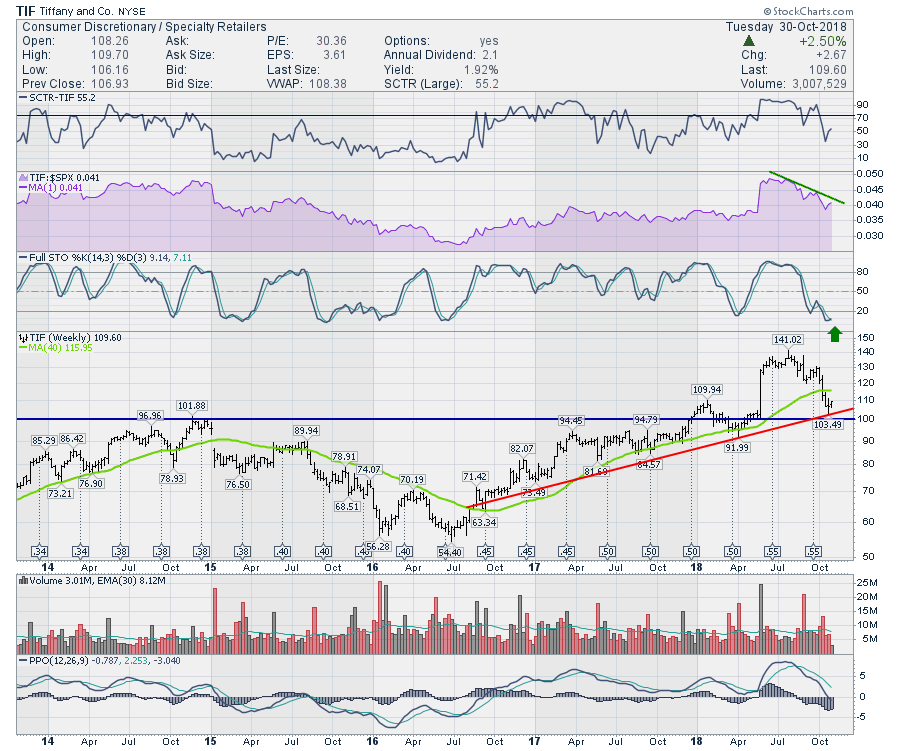
Tiffany's stock has pulled back 25% since July. While that is not good, it is very similar to a significant number of consumer discretionary stocks. There are lots of nice setups on retail stocks currently. Tiffany's lines up support at $100... Read More
Don't Ignore This Chart! October 29, 2018 at 10:42 AM
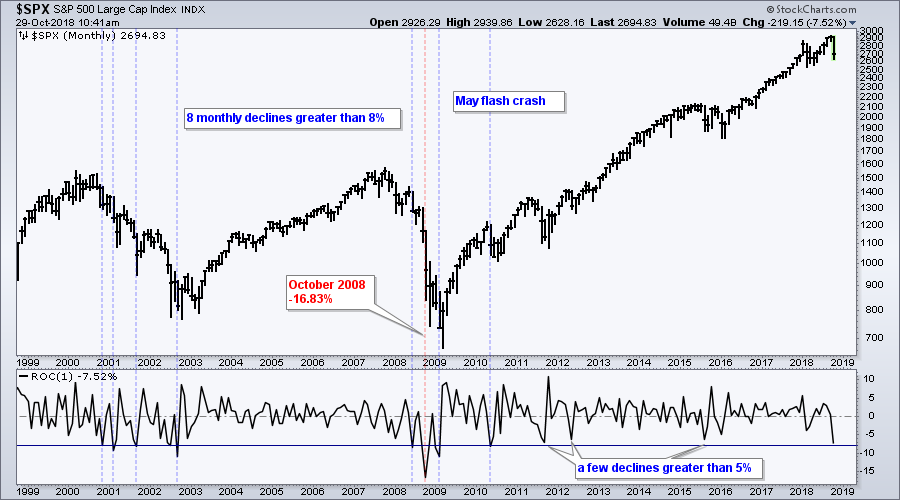
The S&P 500 is down around 7.5% so far this month and this is shaping up to be the worst monthly decline in over five years. Keep in mind that there are still a few days left in October and the last monthly bar will not complete until the close on Wednesday... Read More
Don't Ignore This Chart! October 26, 2018 at 07:00 PM
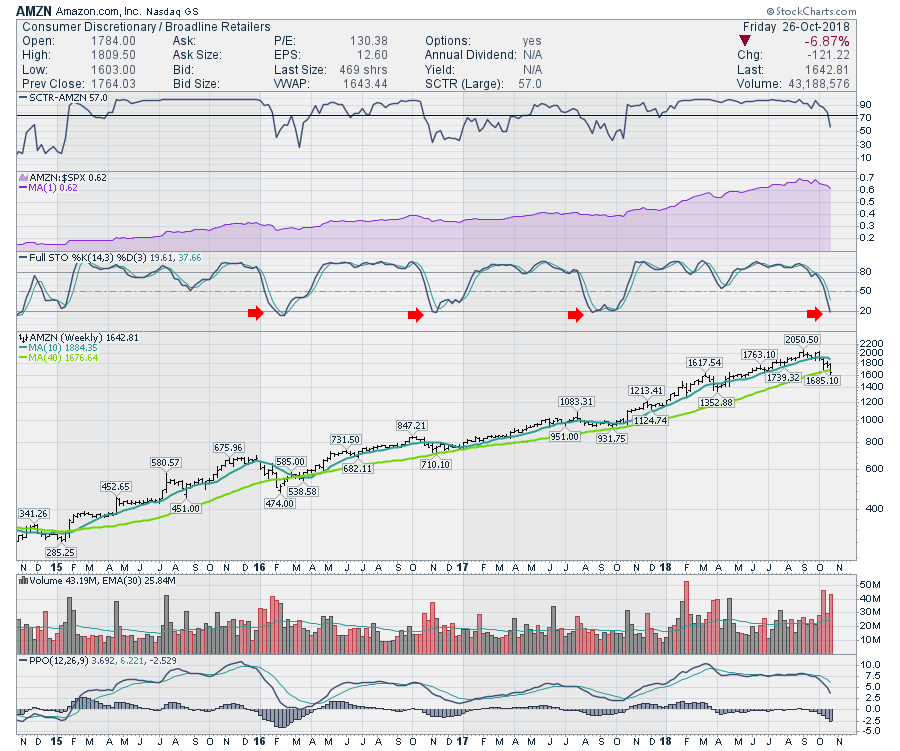
Amazon has had a rough month in October. With the stock dropping $450 or 20% from its highs, it is clearly being marked down... Read More
Don't Ignore This Chart! October 25, 2018 at 07:45 AM
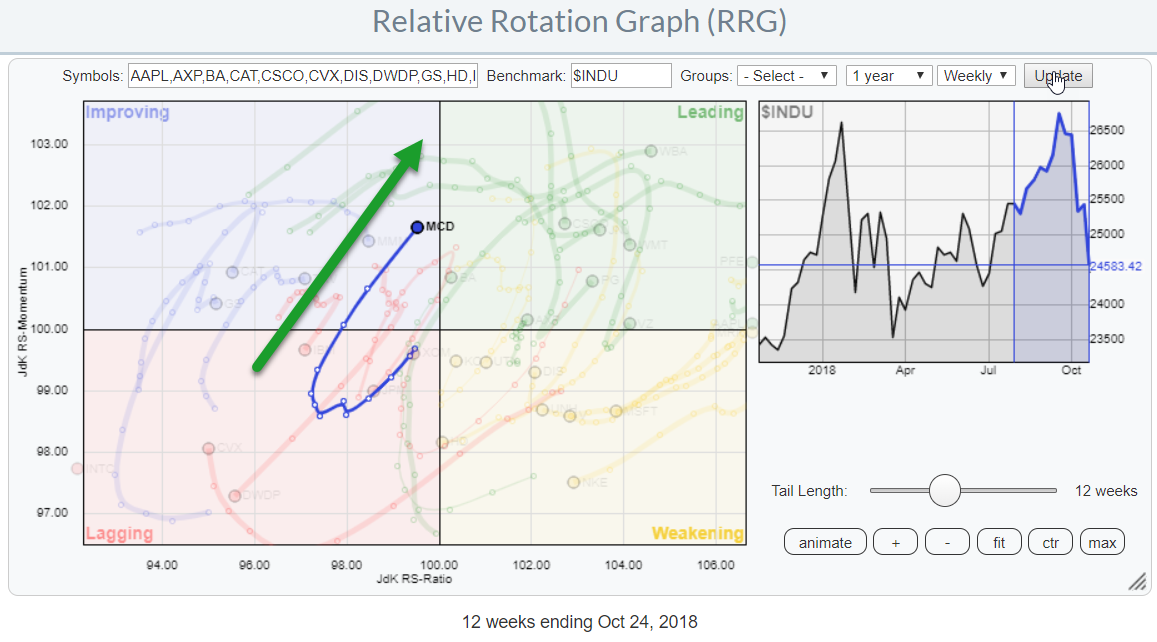
On the Relative Rotation Graph holding the 30 stocks in the DJ Industrials index, McDonald's (MCD) is one of the names that pop up as potentially interesting... Read More
Don't Ignore This Chart! October 24, 2018 at 09:04 AM

The pickings are getting slim after sharp declines in October, but some stocks are holding up better than others. The Software iShares (IGV), in particular, held up better than most industry group ETFs and Adobe (ADBE) is a leader in this group... Read More
Don't Ignore This Chart! October 23, 2018 at 08:20 PM
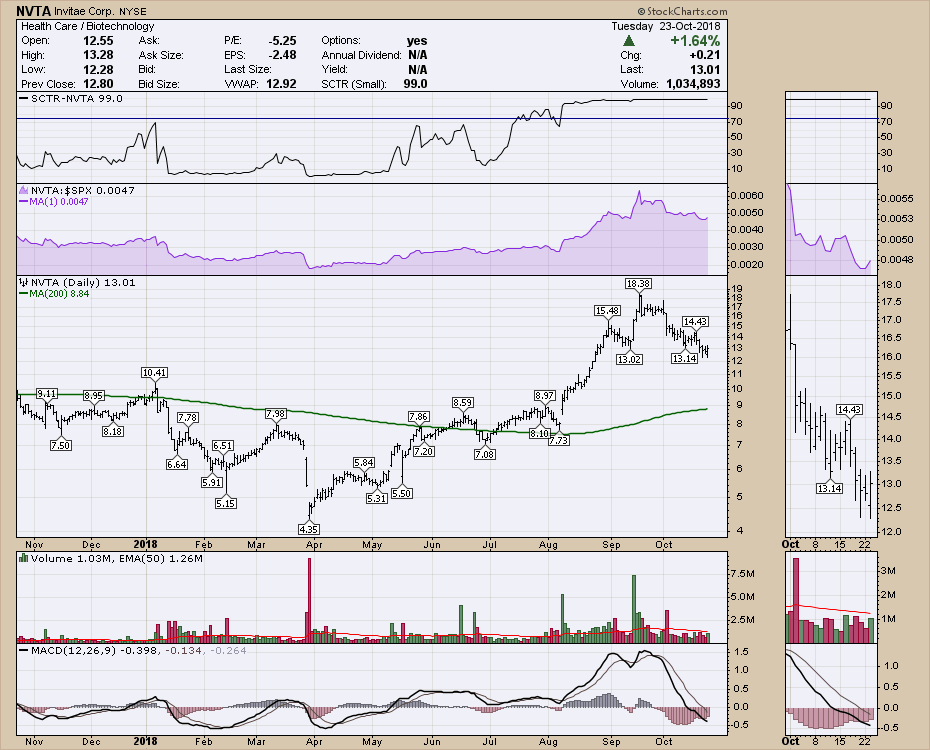
Invitae Corp is a small biotech that has been in an uptrend since April. Over the last month the stock has pulled back to find support at the recent lows. On Tuesday, Invitae Corp (NVTA) printed a nice hammer candle that you can see in the zoom panel... Read More
Don't Ignore This Chart! October 22, 2018 at 11:31 AM
Citigroup (C) is leading the Financials SPDR (XLF) lower with a lower high in September and a rising wedge break in October. The chart shows weekly bars for Citigroup over the last three years... Read More
Don't Ignore This Chart! October 19, 2018 at 02:53 PM
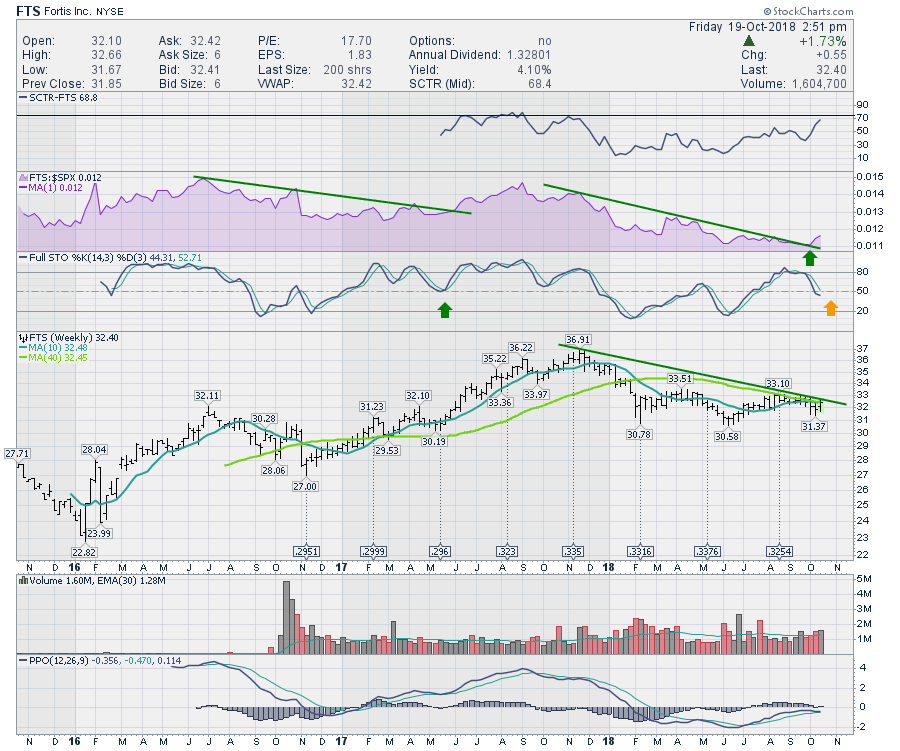
Fortis is a North American utility company that is set up quite nicely here. The annual dividend is 4% and the quarterly payment is due in November. This chart intrigues me because the setup across a lot of the pipeline and utility charts is similar... Read More
Don't Ignore This Chart! October 18, 2018 at 08:16 AM
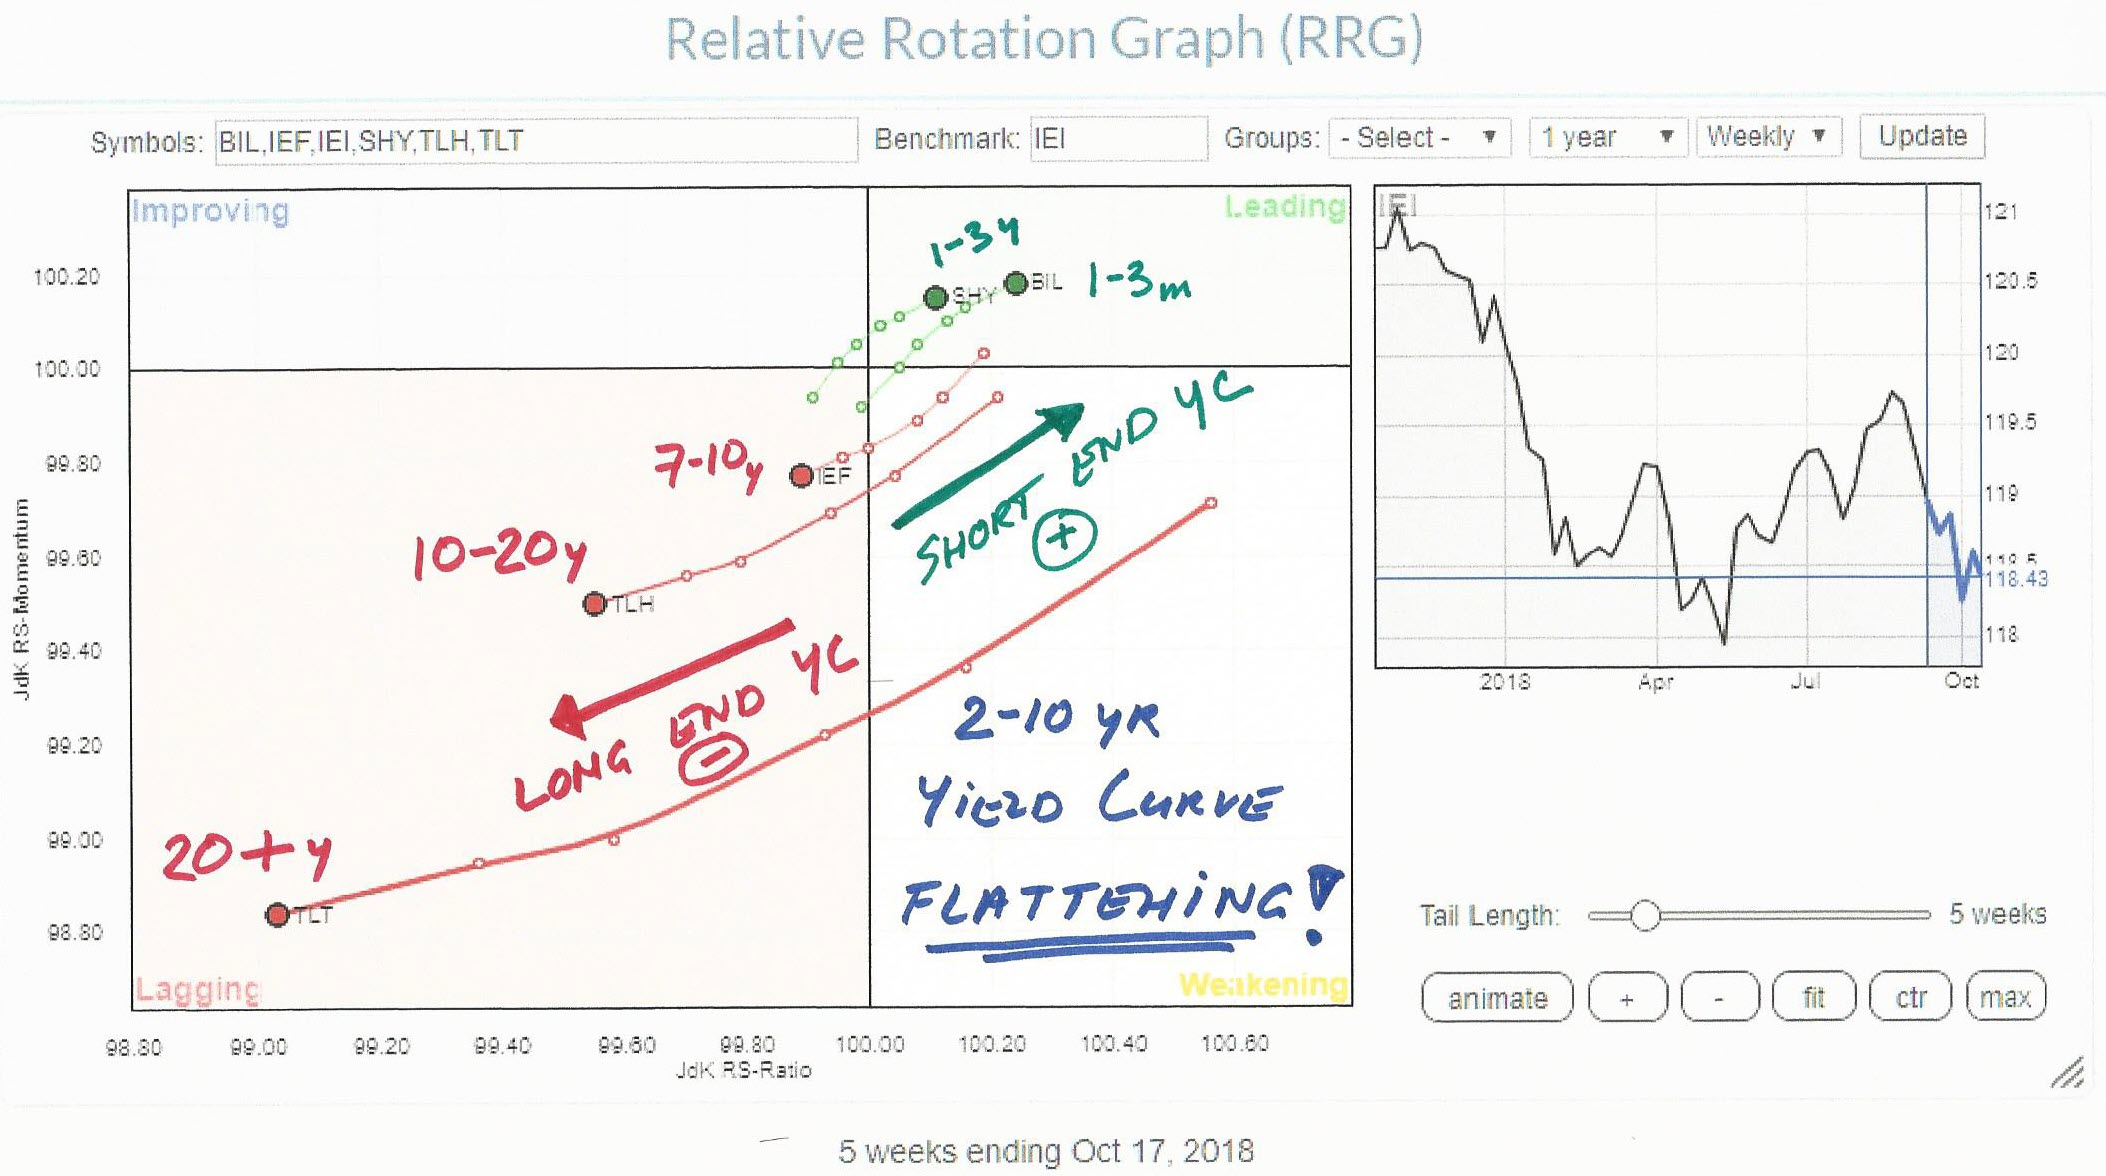
When markets are in transition and the bigger picture needs our attention it is always good to keep an eye on the yield curve. The absolute yield levels of the various maturities on the curve, starting at 3-Months all the way out to 20+ years are important to monitor... Read More
Don't Ignore This Chart! October 17, 2018 at 07:11 AM

The S&P 500 fell to its lowest level since early July and pierced its 200-day moving average last week. Chartists looking for stocks that held up better during this decline can use these levels for comparison... Read More
Don't Ignore This Chart! October 16, 2018 at 03:33 PM
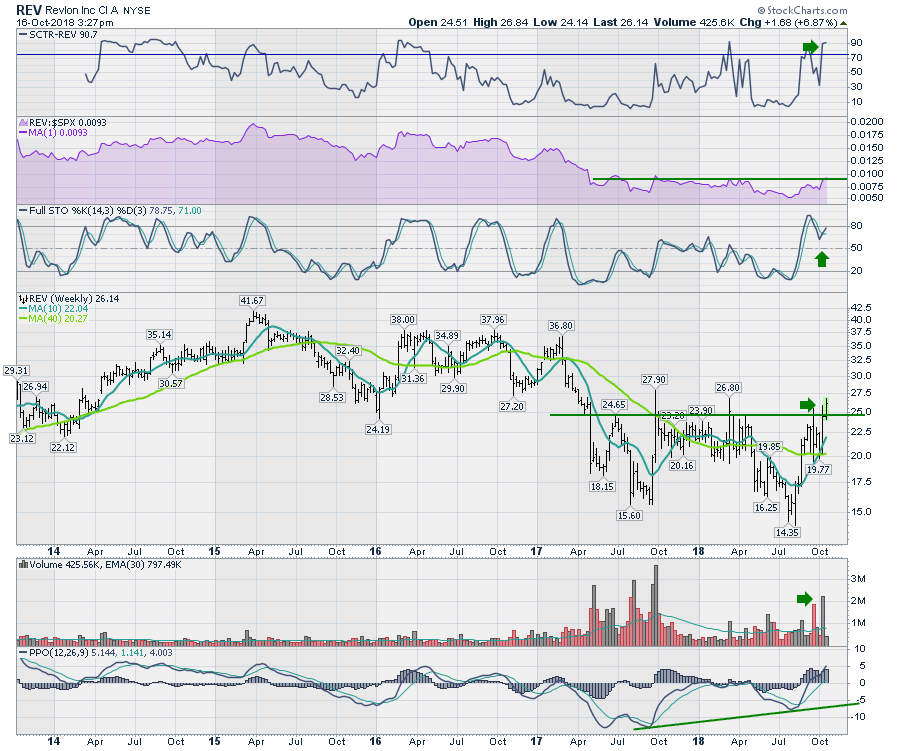
Revlon (REV) showed up on the 52 week high scan today. On the chart there were some intra-week moves to higher levels but based on close only daily data, Revlon is pushing up. What is really important is the relative strength of Revlon... Read More
Don't Ignore This Chart! October 15, 2018 at 04:21 PM

The broad market environment is a bit shaky right now, but Ultra Beauty (ULTA) is holding up relatively well with a normal pullback after a big breakout. First and foremost, the stock is in a long-term uptrend after a breakout, surge and 52-week high in September... Read More
Don't Ignore This Chart! October 12, 2018 at 10:01 AM
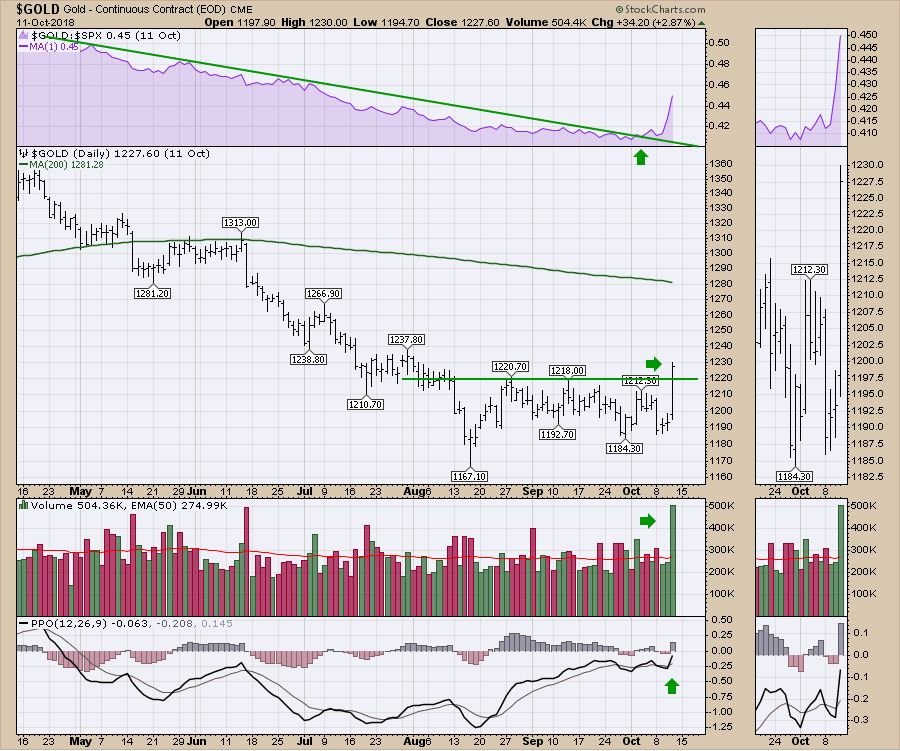
$GOLD had a big day on Thursday with a $34 move. While Gold has been out of favor so long, everyone has ignored it. If you are looking for something moving positive while the market stresses here, Gold related trades might be part of your solution... Read More
Don't Ignore This Chart! October 11, 2018 at 10:53 AM
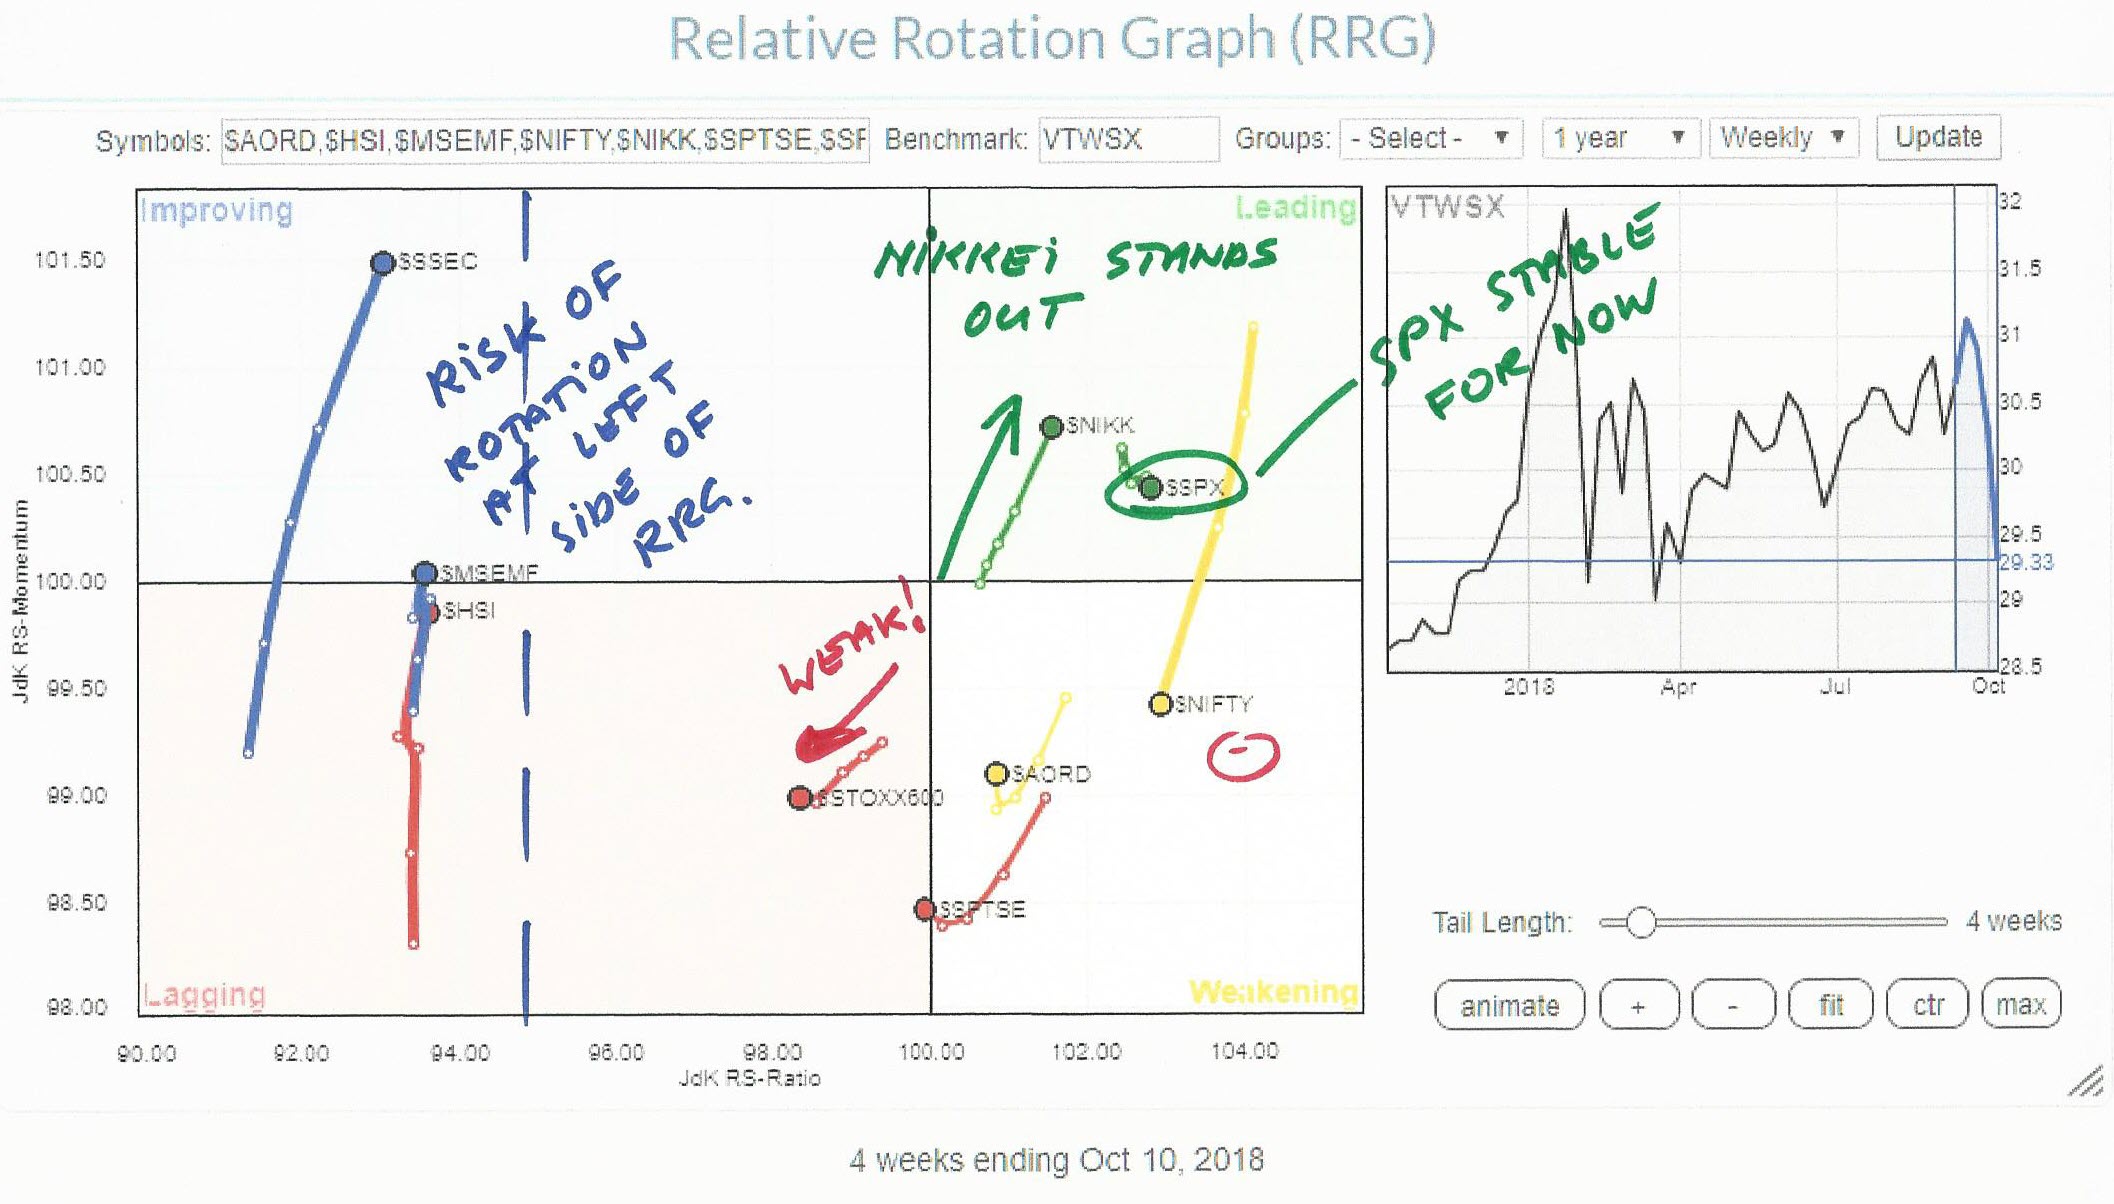
When markets around the world start to rumble it's usually a good exercise how all these moves compare against one another. The Relative Rotation Graph shows the relative picture for a number of major world equity markets against the Dow Jones World Index as the benchmark... Read More
Don't Ignore This Chart! October 10, 2018 at 08:28 AM

Walmart (WMT) is making waves again with a massive breakout in August and a small breakout on Tuesday. WMT underperformed the market the first half of the year with a 25% decline from the January high to the May low... Read More
Don't Ignore This Chart! October 09, 2018 at 07:30 PM
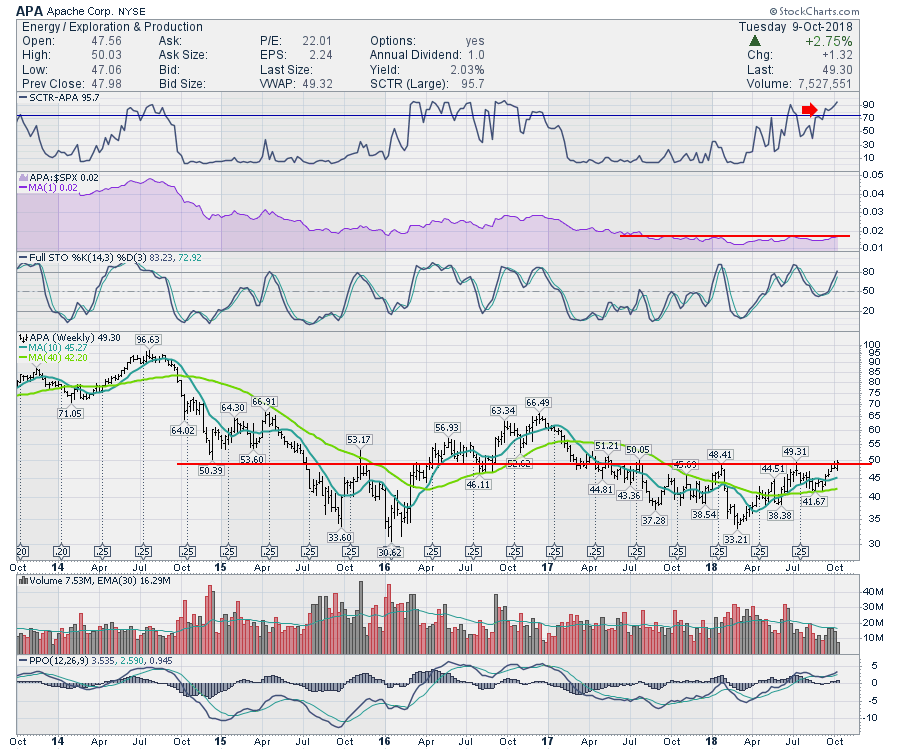
Apache (APA) has been building a base between $35 and $50. A measured move would suggest a retest of the highs at $66 over the next year. Apache also pays a dividend... Read More
Don't Ignore This Chart! October 08, 2018 at 11:22 AM

Last week was tough on stocks as the S&P 500 SPDR declined around 1%, the Nasdaq 100 ETF fell 3% and the Biotech iShares plunged 4.5%. Despite a rough week, note that some 180 stocks in the S&P 500 closed higher and bucked the selling pressure... Read More
Don't Ignore This Chart! October 05, 2018 at 09:21 AM
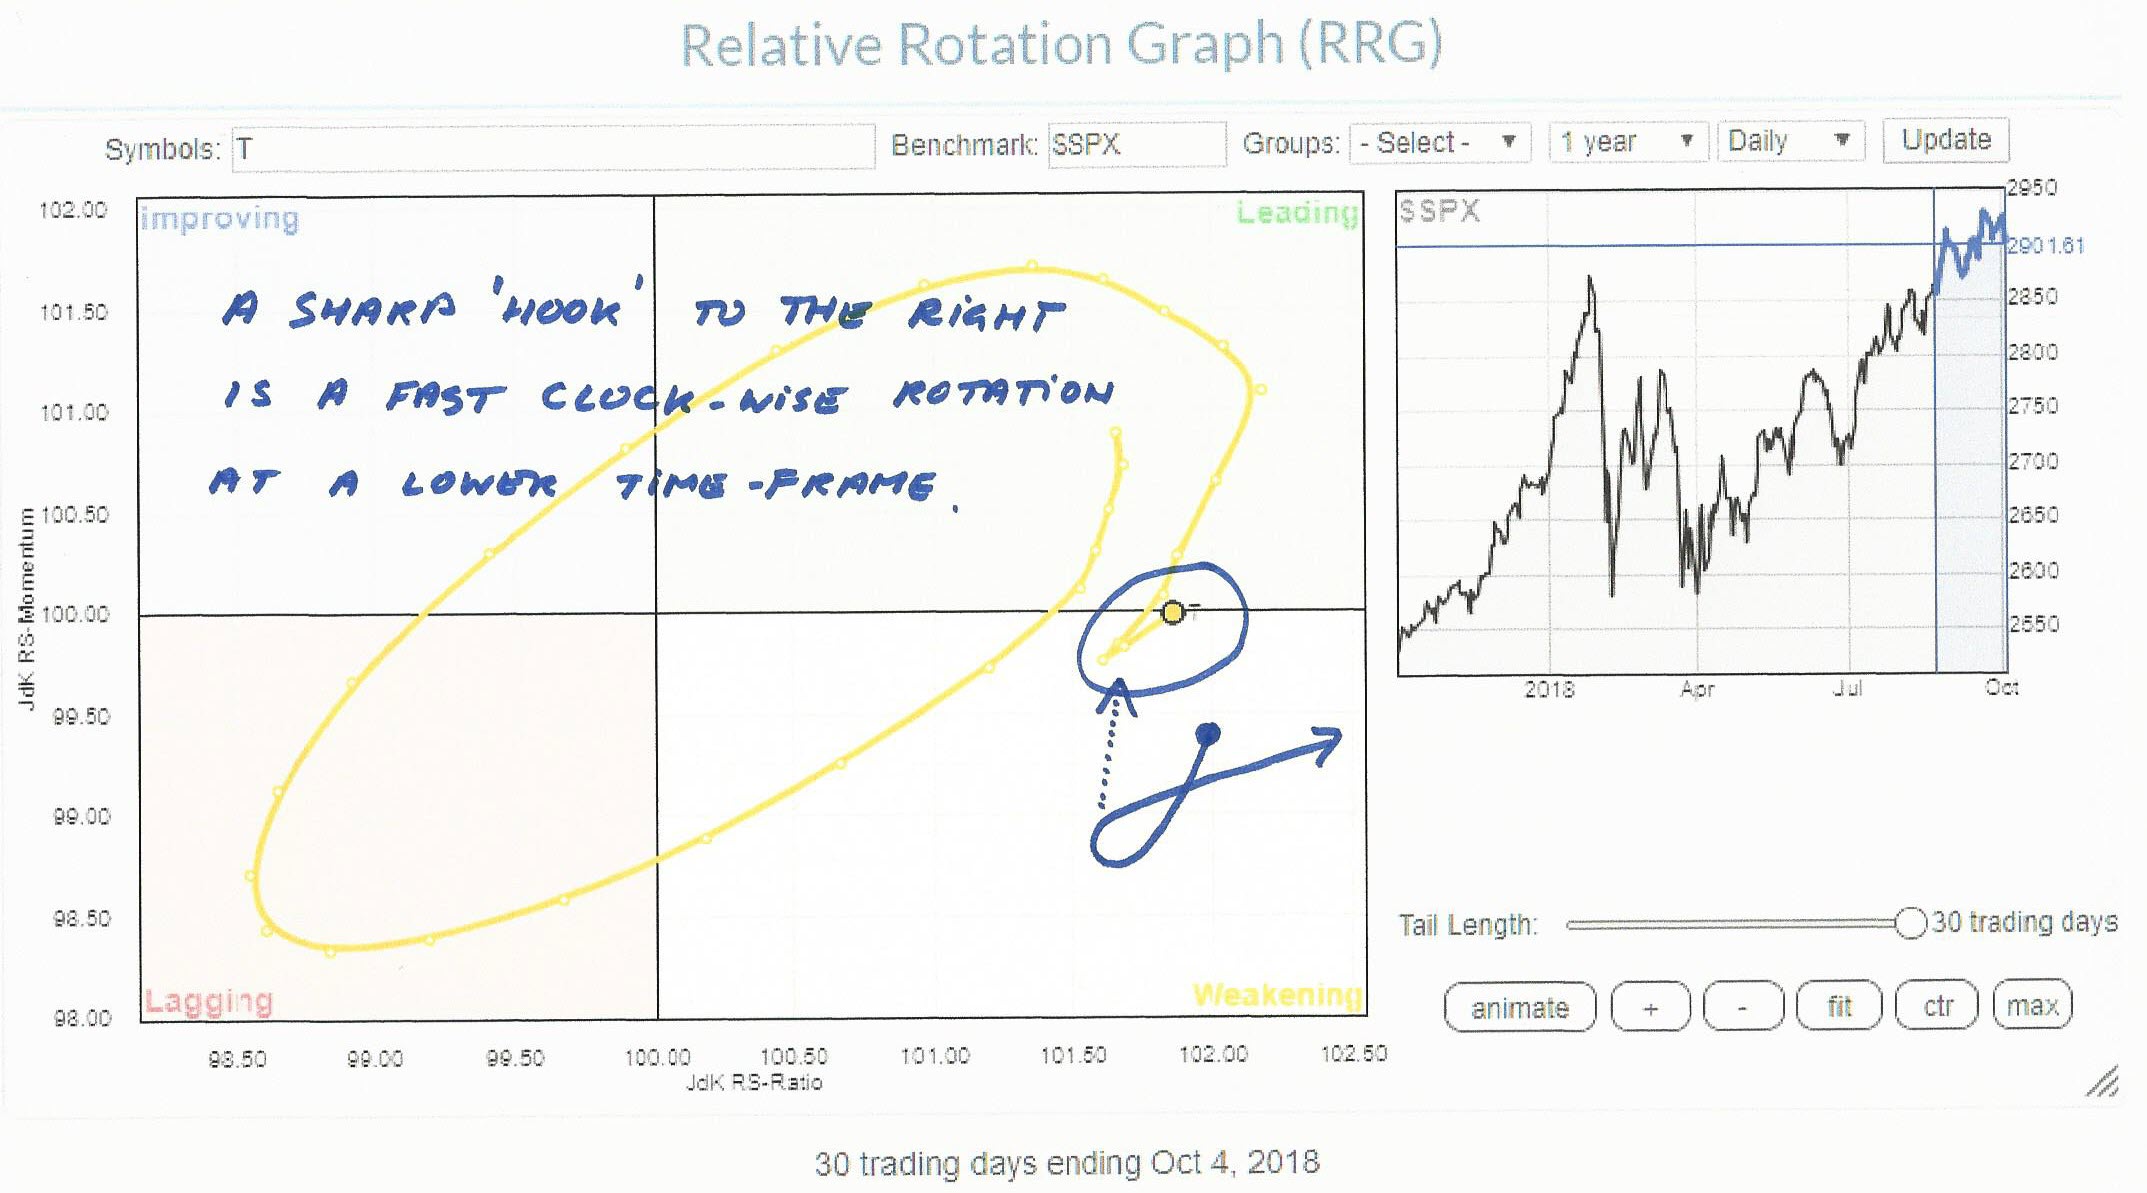
After yesterday's close (10/4) I ran a Relative Rotation Graph of the Top-10 Market Movers inside the S&P-500 index... Read More
Don't Ignore This Chart! October 04, 2018 at 05:04 AM
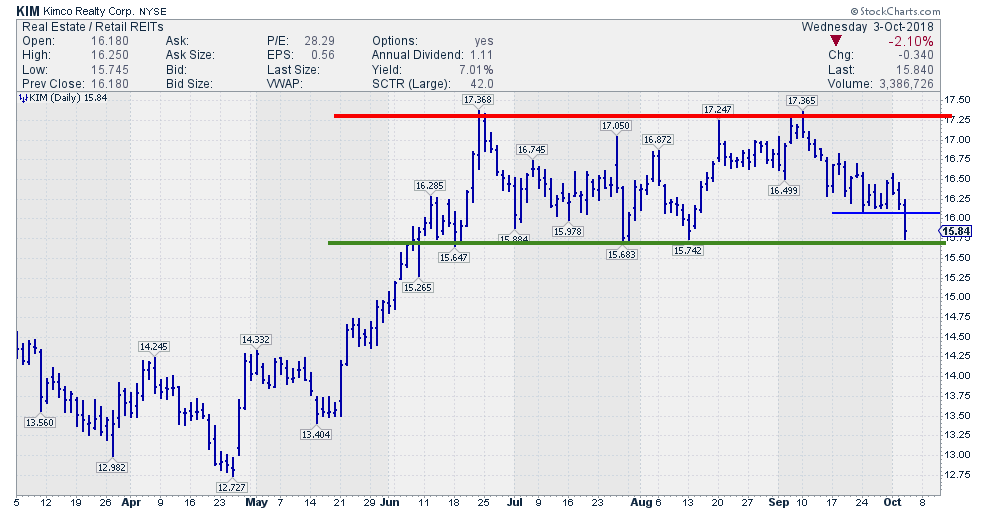
One of the names that popped up today on my alert for potential "Turtle Soup" setups is KIM. After opening up the chart for further inspection I noticed an interesting situation. It is very clear that the stock is in a trading range since June. The upper boundary around $ 17... Read More
Don't Ignore This Chart! October 03, 2018 at 08:04 AM

The Health Care SPDR (XLV) is the best performing sector over the last six months with a 21% gain and the Medical Devices ETF (IHI) is one of the top performing industry group ETFs with a 25% gain... Read More
Don't Ignore This Chart! October 02, 2018 at 09:31 AM
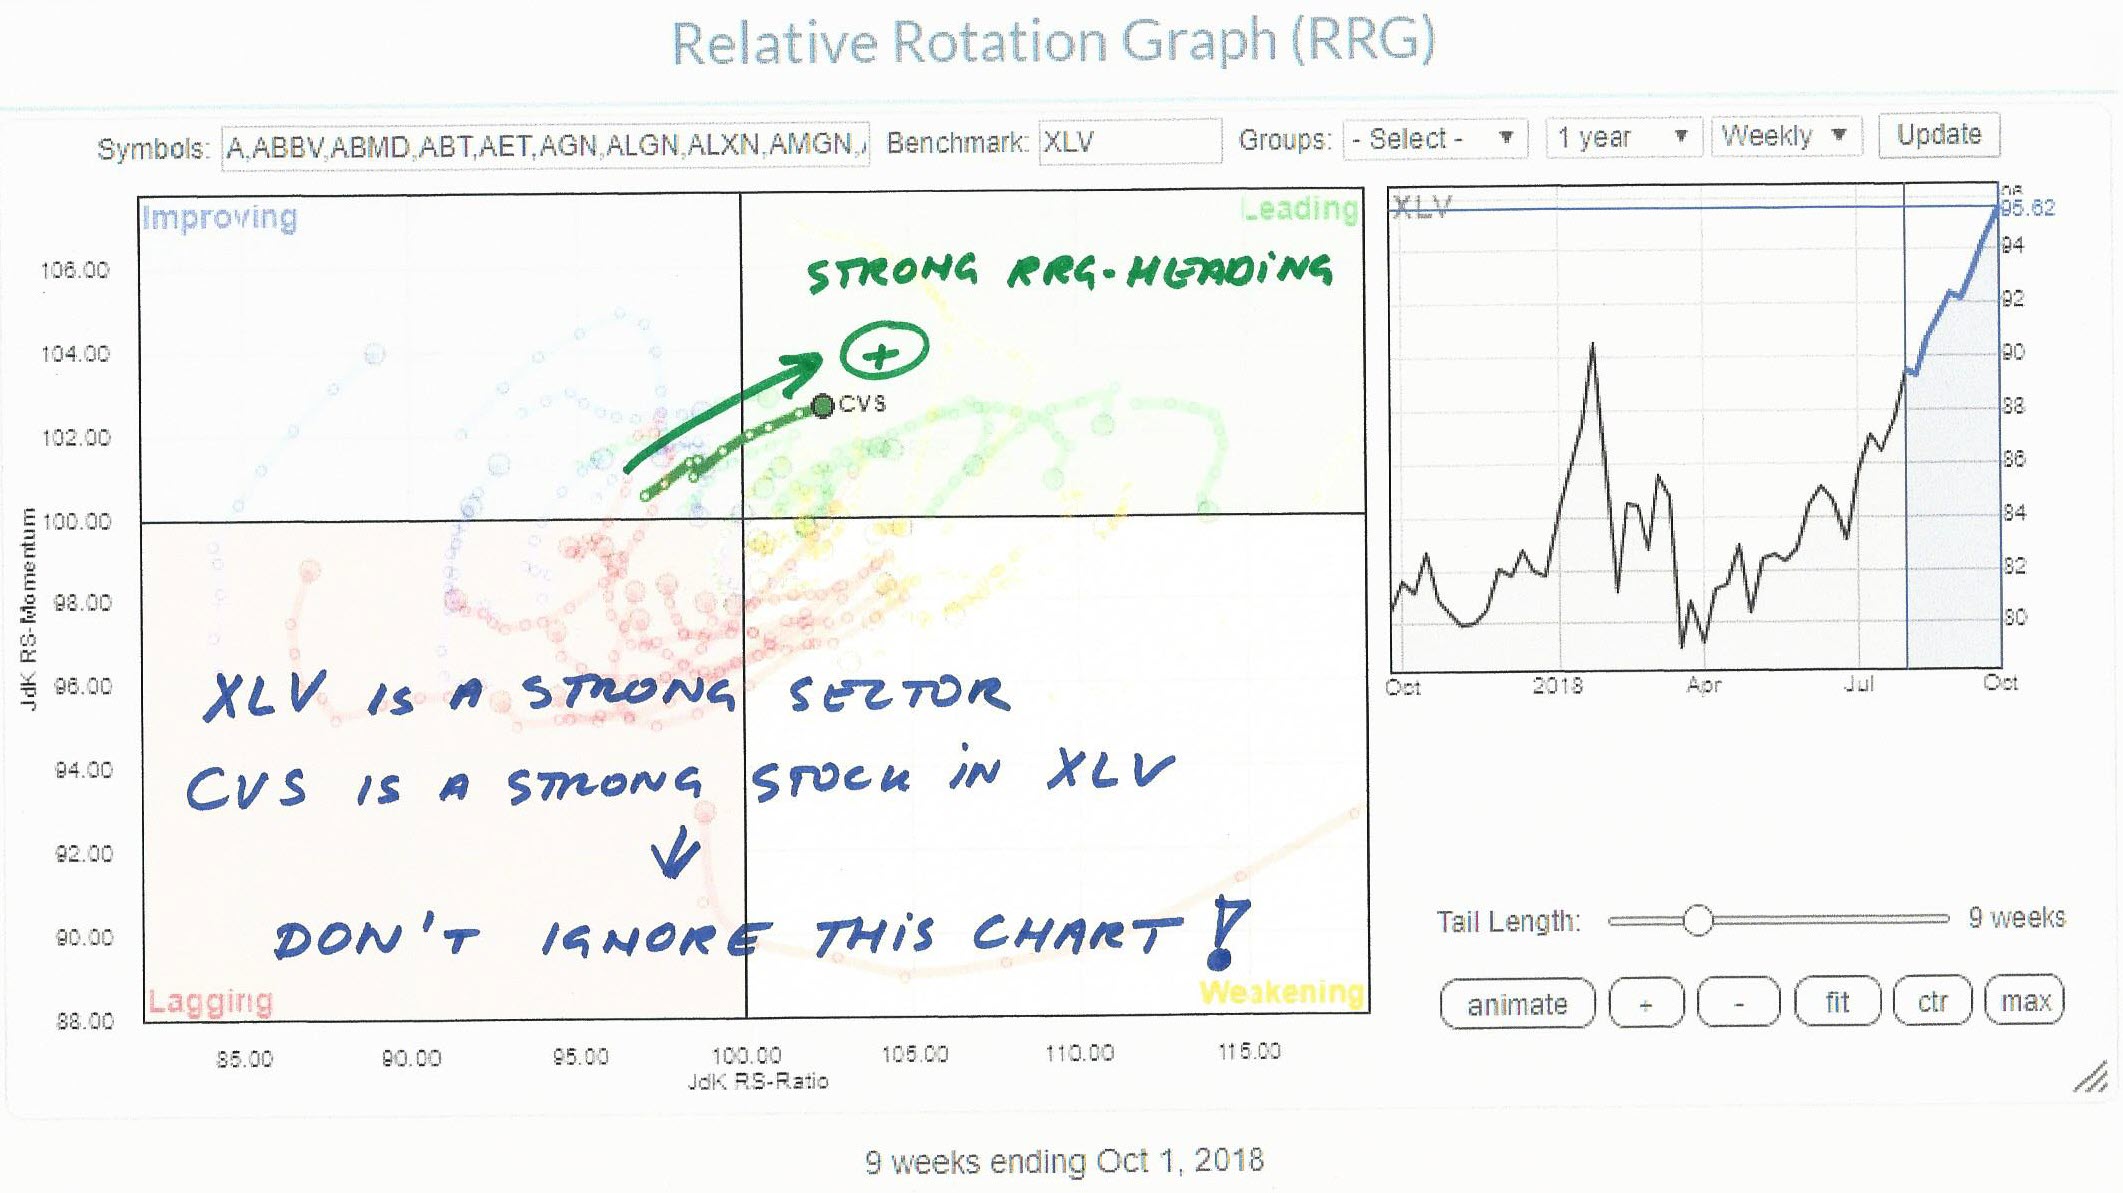
The Healthcare sector is getting a lot of attention lately. Not surprisingly as it is THE leading sector at the moment. Yesterday when I was working on my most recent RRG blog, XLV made it to the headline. And for good reasons... Read More
Don't Ignore This Chart! October 01, 2018 at 11:40 AM

The Health Care SPDR (XLV) is the strongest sector over the last six months (+19%) and the HealthCare Providers ETF (IHF) is one of the strongest industry groups (+27%). UnitedHealth (UNH) is the top holding in IHF and accounts for 12.5% of the ETF... Read More