 The pickings are getting slim after sharp declines in October, but some stocks are holding up better than others. The Software iShares (IGV), in particular, held up better than most industry group ETFs and Adobe (ADBE) is a leader in this group.
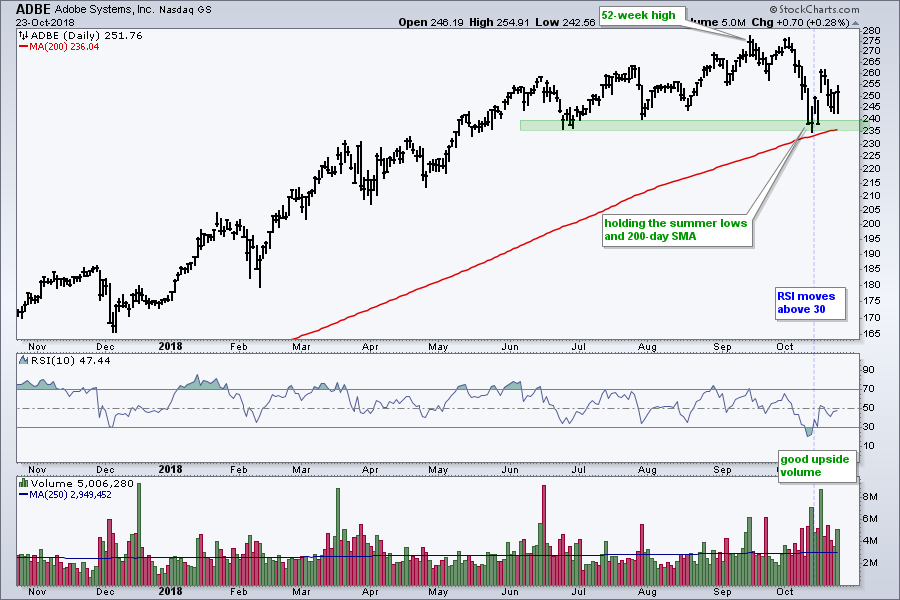
The chart below shows Adobe falling sharply in the first half of October, but managing to hold the summer lows and 200-day SMA. The S&P 500, in contrast, broke its 200-day during the October decline. This means Adobe is holding up better.
 On the price chart, the stock bounced off support in mid October and managed to hold above this zone last week. This reaffirms support in the 235-240 area. A close below 235 would break support and call for a re-evaluation.
The first indicator window shows RSI moving below 30 for the first time in 2018. This shows just how shallow the pullbacks have been this year. RSI also got an oversold bounce as the indicator moved above 30. Furthermore, this bounce appears to be with pretty good upside volume. Note that Adobe reports earnings on December 13th.
On Trend on Youtube
Available to everyone, On Trend with Arthur Hill airs Tuesdays at 10:30AM ET on StockCharts TV and repeats throughout the week at the same time. Each show is then archived on our Youtube channel.
Topics for Tuesday, October 2nd:
- NDX is Last Index Standing ($SPX, $MID, $SML)
- Consumer Discretionary Leads New Low List! (XLB, XLI, XLK)
- EW Staples, Utilities and Healthcare Hold Up (for now)
- Banks Break Down Further (XLF, KRE, KBE, IAI)
- Gold vs Dollar and XLU vs 10-yr Yield
- Walk around the World ($NIKK, $BVSP, $BSE)
- Click here to Watch
Plan Your Trade and Trade Your Plan.
- Arthur Hill, CMT
Senior Technical Analyst, StockCharts.com
Book: Define the Trend and Trade the Trend
Twitter: Follow @ArthurHill
