Amazon has had a rough month in October. With the stock dropping $450 or 20% from its highs, it is clearly being marked down. The real question is can we buy the stock for the holiday season? Can Amazon be a set up for the holiday season?
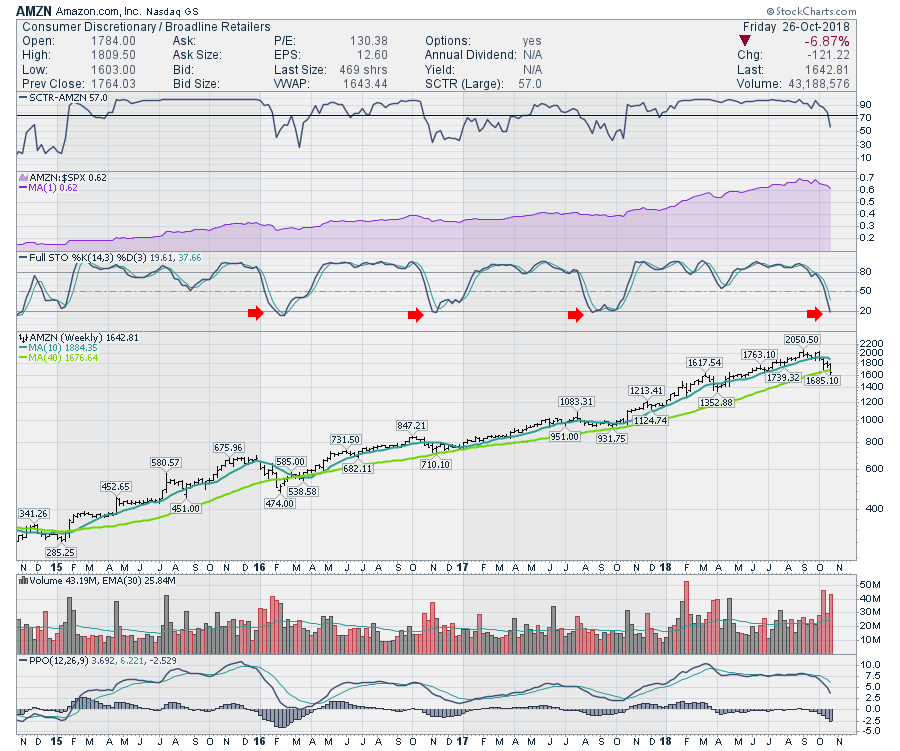
I like the weekly Full Stochastic signal here. This is a once a year signal that shows up for Amazon and typically leads to a great run in the stock. This means the stock is in the setup zone and we need to wait for a confirming signal to buy if you are a weekly chart investor. The last time price dipped below the 40 Week moving average was on the 2016 low and it became a spectacular spot to buy.
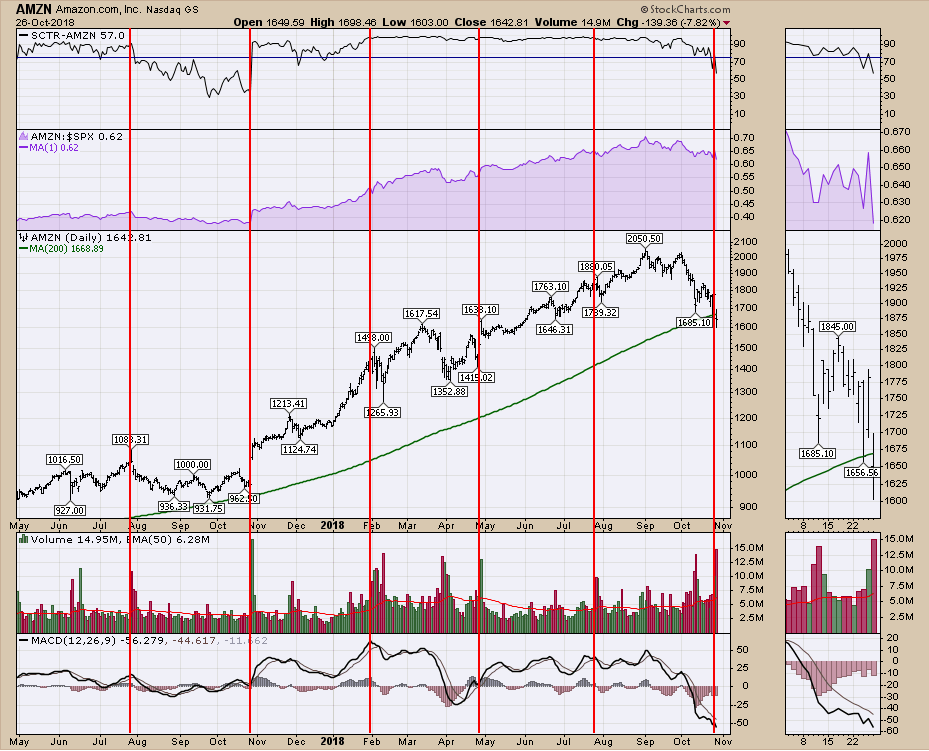
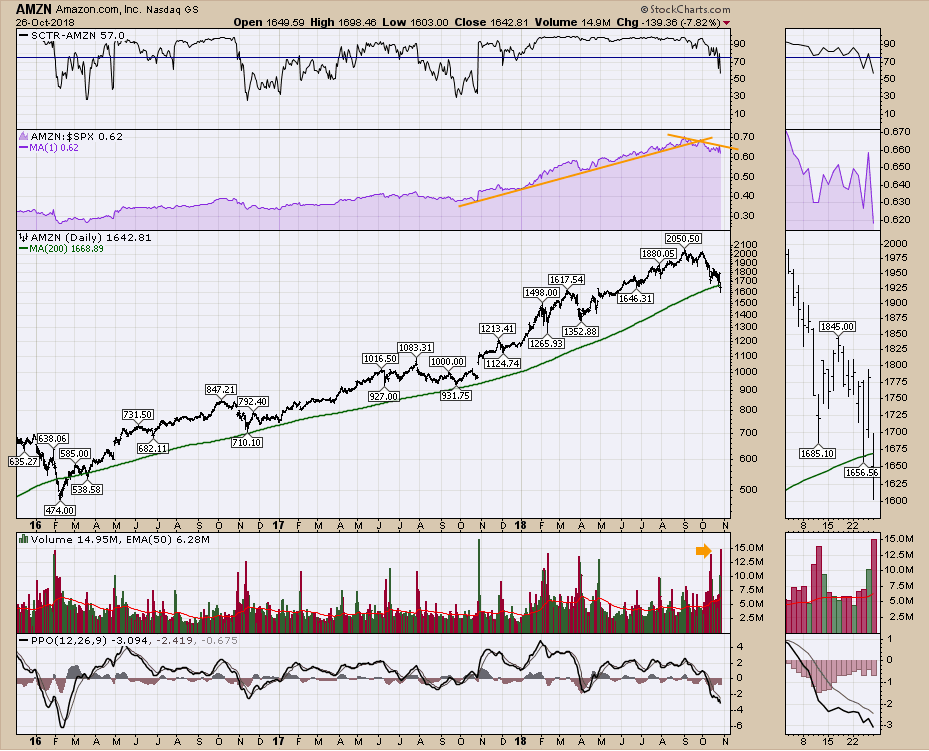
 Moving to the daily chart, an investor looking at Amazon has all kinds of reasons to be interested. The PPO is deeply oversold here. We can also see on the SCTR ranking above, after Amazon broke below 75 it took a while to build a base for the stock. That adds caution for me, but for a first pullback, this chart seems ready for a rebound. The red lines are the earnings dates over the last 6 quarters.
 Buying near the low in 2016 at $500 generated a beautiful 400% gain over 3 years. Waiting for the stock to regain the 200 DMA was a $75 move off the lows or 15%. Try to figure out an entry and make sure a stop is placed below in case the overall market continues to let go. Friday was also the second highest volume on Amazon on the chart. One would have to think that anyone who wanted to sell probably found the reason with the morning pull back off earnings. Capitulation Volume at 2.5 x the average? I will note that the PPO lows are not really rounded bases. They are sudden bases so once the stock reverses, profits are made quickly!
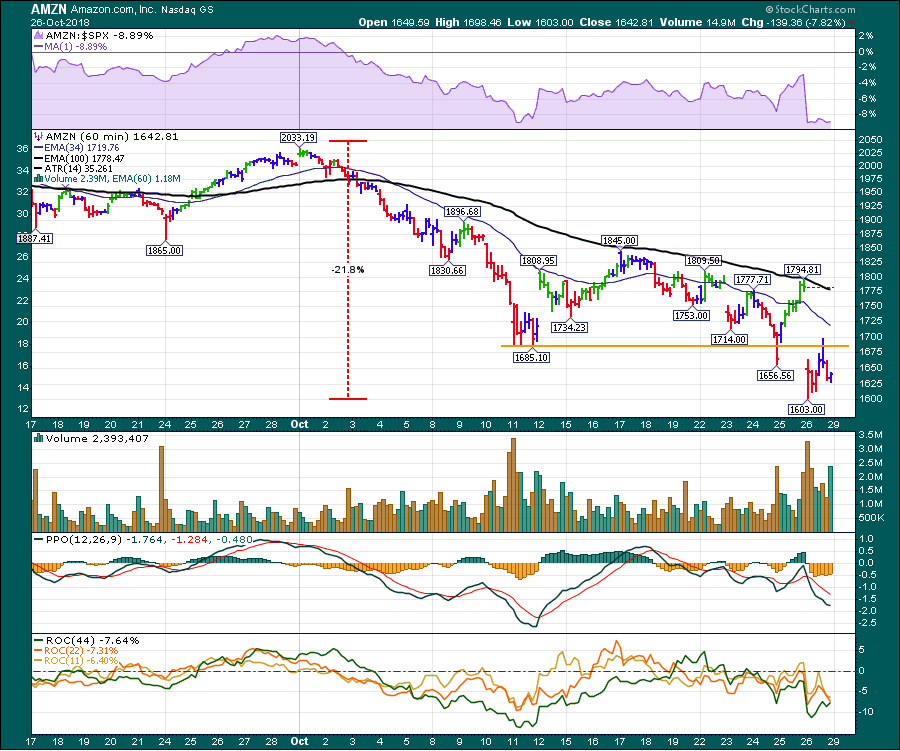
 Here is Amazon on a 60 minute chart. From the high of $2050, the pull back is 21%. A break above the orange line would be a move back through resistance.
 The risk reward sets up pretty nicely here off the back off the earnings report. You'll need to find an entry and a stop, but the setup is compelling on the weekly, daily, hourly charts. The entries you choose may be at different levels based on your time frame. The scale looks normal on this 60 minute chart but a 20% decline in one month is definitely bigger than usual on this massive business.The Amazon chart looks like a place to focus in on for me. The full stochastic reading below 20% is an annual treat from Amazon. Perhaps this year they are bringing Halloween treats to your portfolio instead of candy. Figure out your time horizon if you are interested in the stock. But somewhere down here, this company should fit most investor profiles.
Below are three of my recently recorded videos. The Canadian Technician video shows the massive breakdown on almost every sector chart in Canada.
Natural Gas has been behaving well but the exploration stocks around Natural Gas are still struggling with the overall market sentiment. Lots of information in here on the commodities and indexes. No new breakouts in currencies. The weekly $CRB chart is at a critical point here. Lithium and rare earth metals, steel and coal, copper and aluminum, gold and silver are all covered here.
This video shows a couple of examples for how to get ready for a rally. Scans to run, and ideas for finding strong stocks in weak market conditions. Probably worth saving a link for use in future years when the market conditions go weak.
If you are missing intermarket signals in the market, follow me on Twitter and check out my Vimeo Channel often. Bookmark it for easy access!
Good trading,
Greg Schnell, CMT, MFTA
Senior Technical Analyst, StockCharts.com
Author, Stock Charts for Dummies
Want to read more from Greg? Be sure to follow his StockCharts blog:
The Canadian Technician
