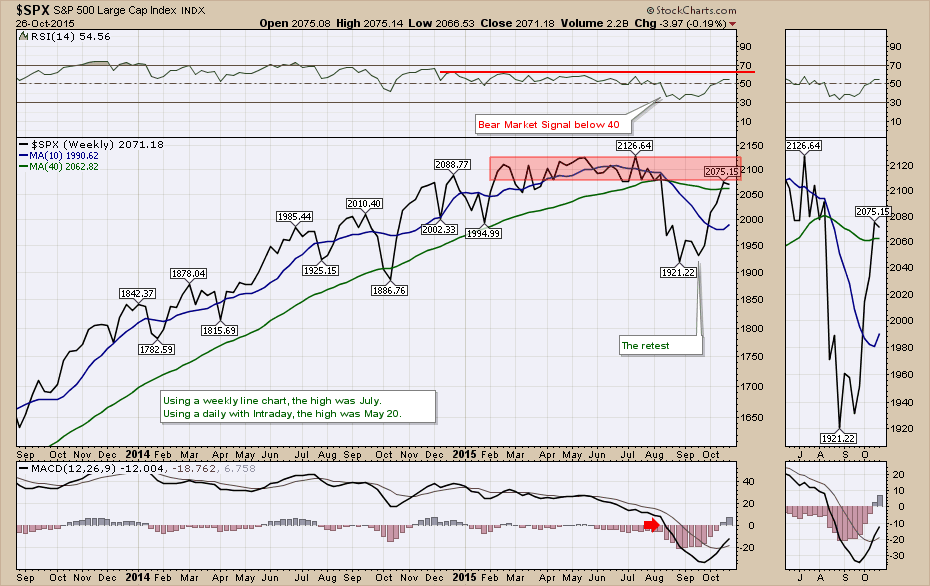
The market has given us some vicious reversals over the years from the 2009 lows. Arthur covered off some internal indicators in yesterday's article where he was looking for strength to show up. Carl Swenlin wrote an article on the weekend that pointed to some internals softening. Click to read Carl's Article. A month ago, we were writing about a retest of the August lows and how important that would be. On October 3rd, I penned an article suggesting the 2060-2080 level would be very important either way as we bounced off the retest of the August lows. The title was ' For Fundamentalists, The Bull Market Resumes. For Technicians, This Is A Very Important Chapter. So the technical community could anticipate that this area was going to be significant, and now we are watching the indicators for information informing us if we have enough breadth to break out or does the market stall and roll over here.
First of all, what clues do we have that this could be a new bear market?
- The weekly RSI dropped below 40 and stayed there for a month. In Connie Browns work, this is an important signal to changes in market trend.
- The RSI has not been above 65 for the entire year. That does not mean it is a bear market, but one of the signals for a bear market is continuously weak readings on the RSI, below 65.
- The $SPX moved sideways for most of 2015. In August, it dropped well below the 40 WMA after testing it in October 2014 and January 2015.
- The 40 WMA is downsloping.
- The MACD on the weekly chart drops below zero.
One of the main tests for a transition from a bull market to a bear market is how it reacts to trying to get back through the downsloping 40 WMA. This area right around the 40 WMA is historically where it stalls out when it reverses to start a meaningful decline into a bear market. The levels on the $SPX would be 2060-2080 which we are sitting in the middle of.
In 2007, we made a high in July, marginally exceeded it on October 9th, 2007 and rolled over. We tested the 40 WMA from below in December 2007 and again in May 2008. If you click on the chart above as a member you can slide the 'Date Ranger' back to see 2007. What I wanted to point out today is if the market rolls over here, it is important to know that we are at the "Last Chance Saloon". If this is a new bear market, this is the best place to buy puts or to exit with the majority of your gains. If this is not a new bear market, this will be the turning point to mark the start of a new uptrend.
The final result does not have to be as dire as 2008, but bear market signals on the RSI are very helpful for indicating when to be concerned or aware of a potential trend change. Technicals are helpful, but trillions can change everything. The Chinese and EU central banks both discussed adding more stimulus last week. The Bank of Japan and the US Fed both meet this week. In 2012, all four CB's added stimulus that spurred a thunderous start to a new rally. The ECB started some additional stimulus in January 2015 but since then some of the equity markets have corrected over 20%. Many fundamental investors have suggested investing in these foreign markets because they have the most accommodative monetary policies and that has not worked out well this year.
The breadth information that Arthur and Carl talked about in their articles would meaningfully change if this is a new leg in the ongoing bull market from 2012. Apple is the largest stock in the world and it reports after the bell. It is included in the $SPX, $OEX, $INDU, $NDX, $COMPQ and $WLSH to name a few. A strong showing by Apple could surge the indexes higher than 2080. The breadth information will distinguish if this is going to widen to the broader market. In 2000 and 2007, there were only a few technology stocks holding the market up while the other stocks were falling below their 40 WMA's. Eventually, all the stocks started to decline. It is starting to feel that way again to me. The last of the large cap tech is Facebook and the company reports November 4th.
I'll be doing a webinar today focused on the Canadian technical picture. There will be a lot of information regarding my views on the US market as well. If you would like to listen in, click here to register. The Canadian Technician. We'll see you online at 5 EST.
Good trading,
Greg Schnell, CMT

