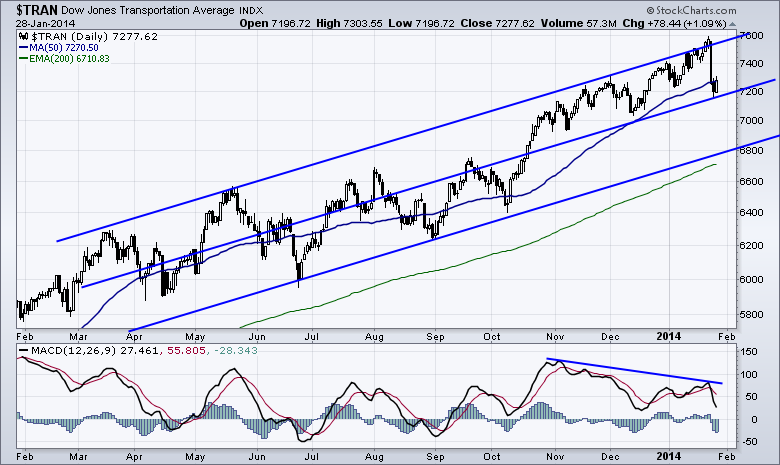
The Transport Index is very interesting here.
The divergence showing on the right hand side marked in blue looks very negative. But on the slope of the transport index, this might just mean a move to the bottom of the channel. Almost all the MACD peaks on the chart are lower than the previous peaks with the exception of November. One thing that makes this chart suspicious is the top of channel blowoff above the channel, and then a quick reversal.
I do notice this is the most abrupt pullback on the chart. Hard to stop the downside momentum after such a quick drop. I would watch for this to test the 7000 level where the last low was made. Then we can see what is going to transpire.
Good trading,
Greg Schnell, CMT

