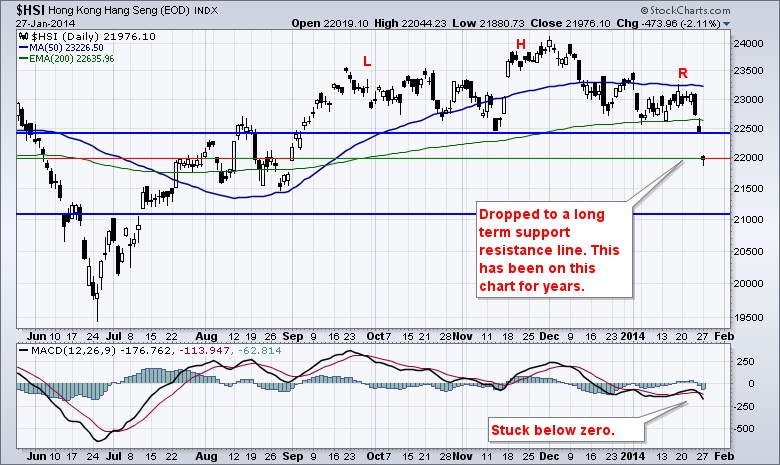
Recently, the Hang Seng has been building a broadening top formation. We'll call it a Head/Shoulders pattern. Note the loss of the 200 DMA again.
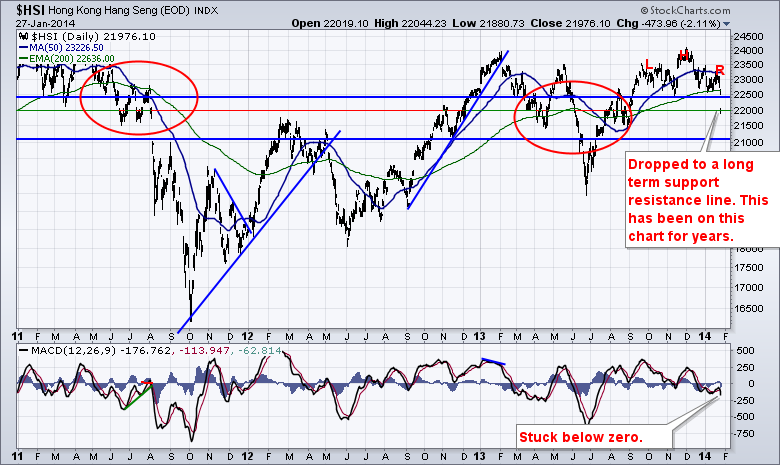
What is more interesting are the lines on the chart. Those lines have been there for years. Let's broaden the view with 3 years of information.
The Hnag Seng built a broad topping pattern in 2011 with support at the same level.
For some reason at this level, the $HSI can really plummet quickly. Check out both the red circle areas. The HSI lost 4000 points quickly going through this area. Even more interesting is on a 6 year view, you can see this is where the $HSI broke down quickly back in 2008.
There seems to be a vaccuum tube at this level.Will this be a precipitous drop back down to 19500 again? Or is it different this time ?
Good trading,
Greg Schnell, CMT


